What an investigation is
An investigation is the case file Okesu builds around an incident. It groups the findings that triggered the case, the IOCs they reference, the orchestration runs you spent investigating, the daimons that reported in, and the operators’ notes — one closed loop per incident.
The point is replayability. Six months later you can open the case and see exactly what happened, who did what when, and which evidence was used to close it. Investigations exist because findings alone aren’t enough: a critical alert is the start of a story, not the end.
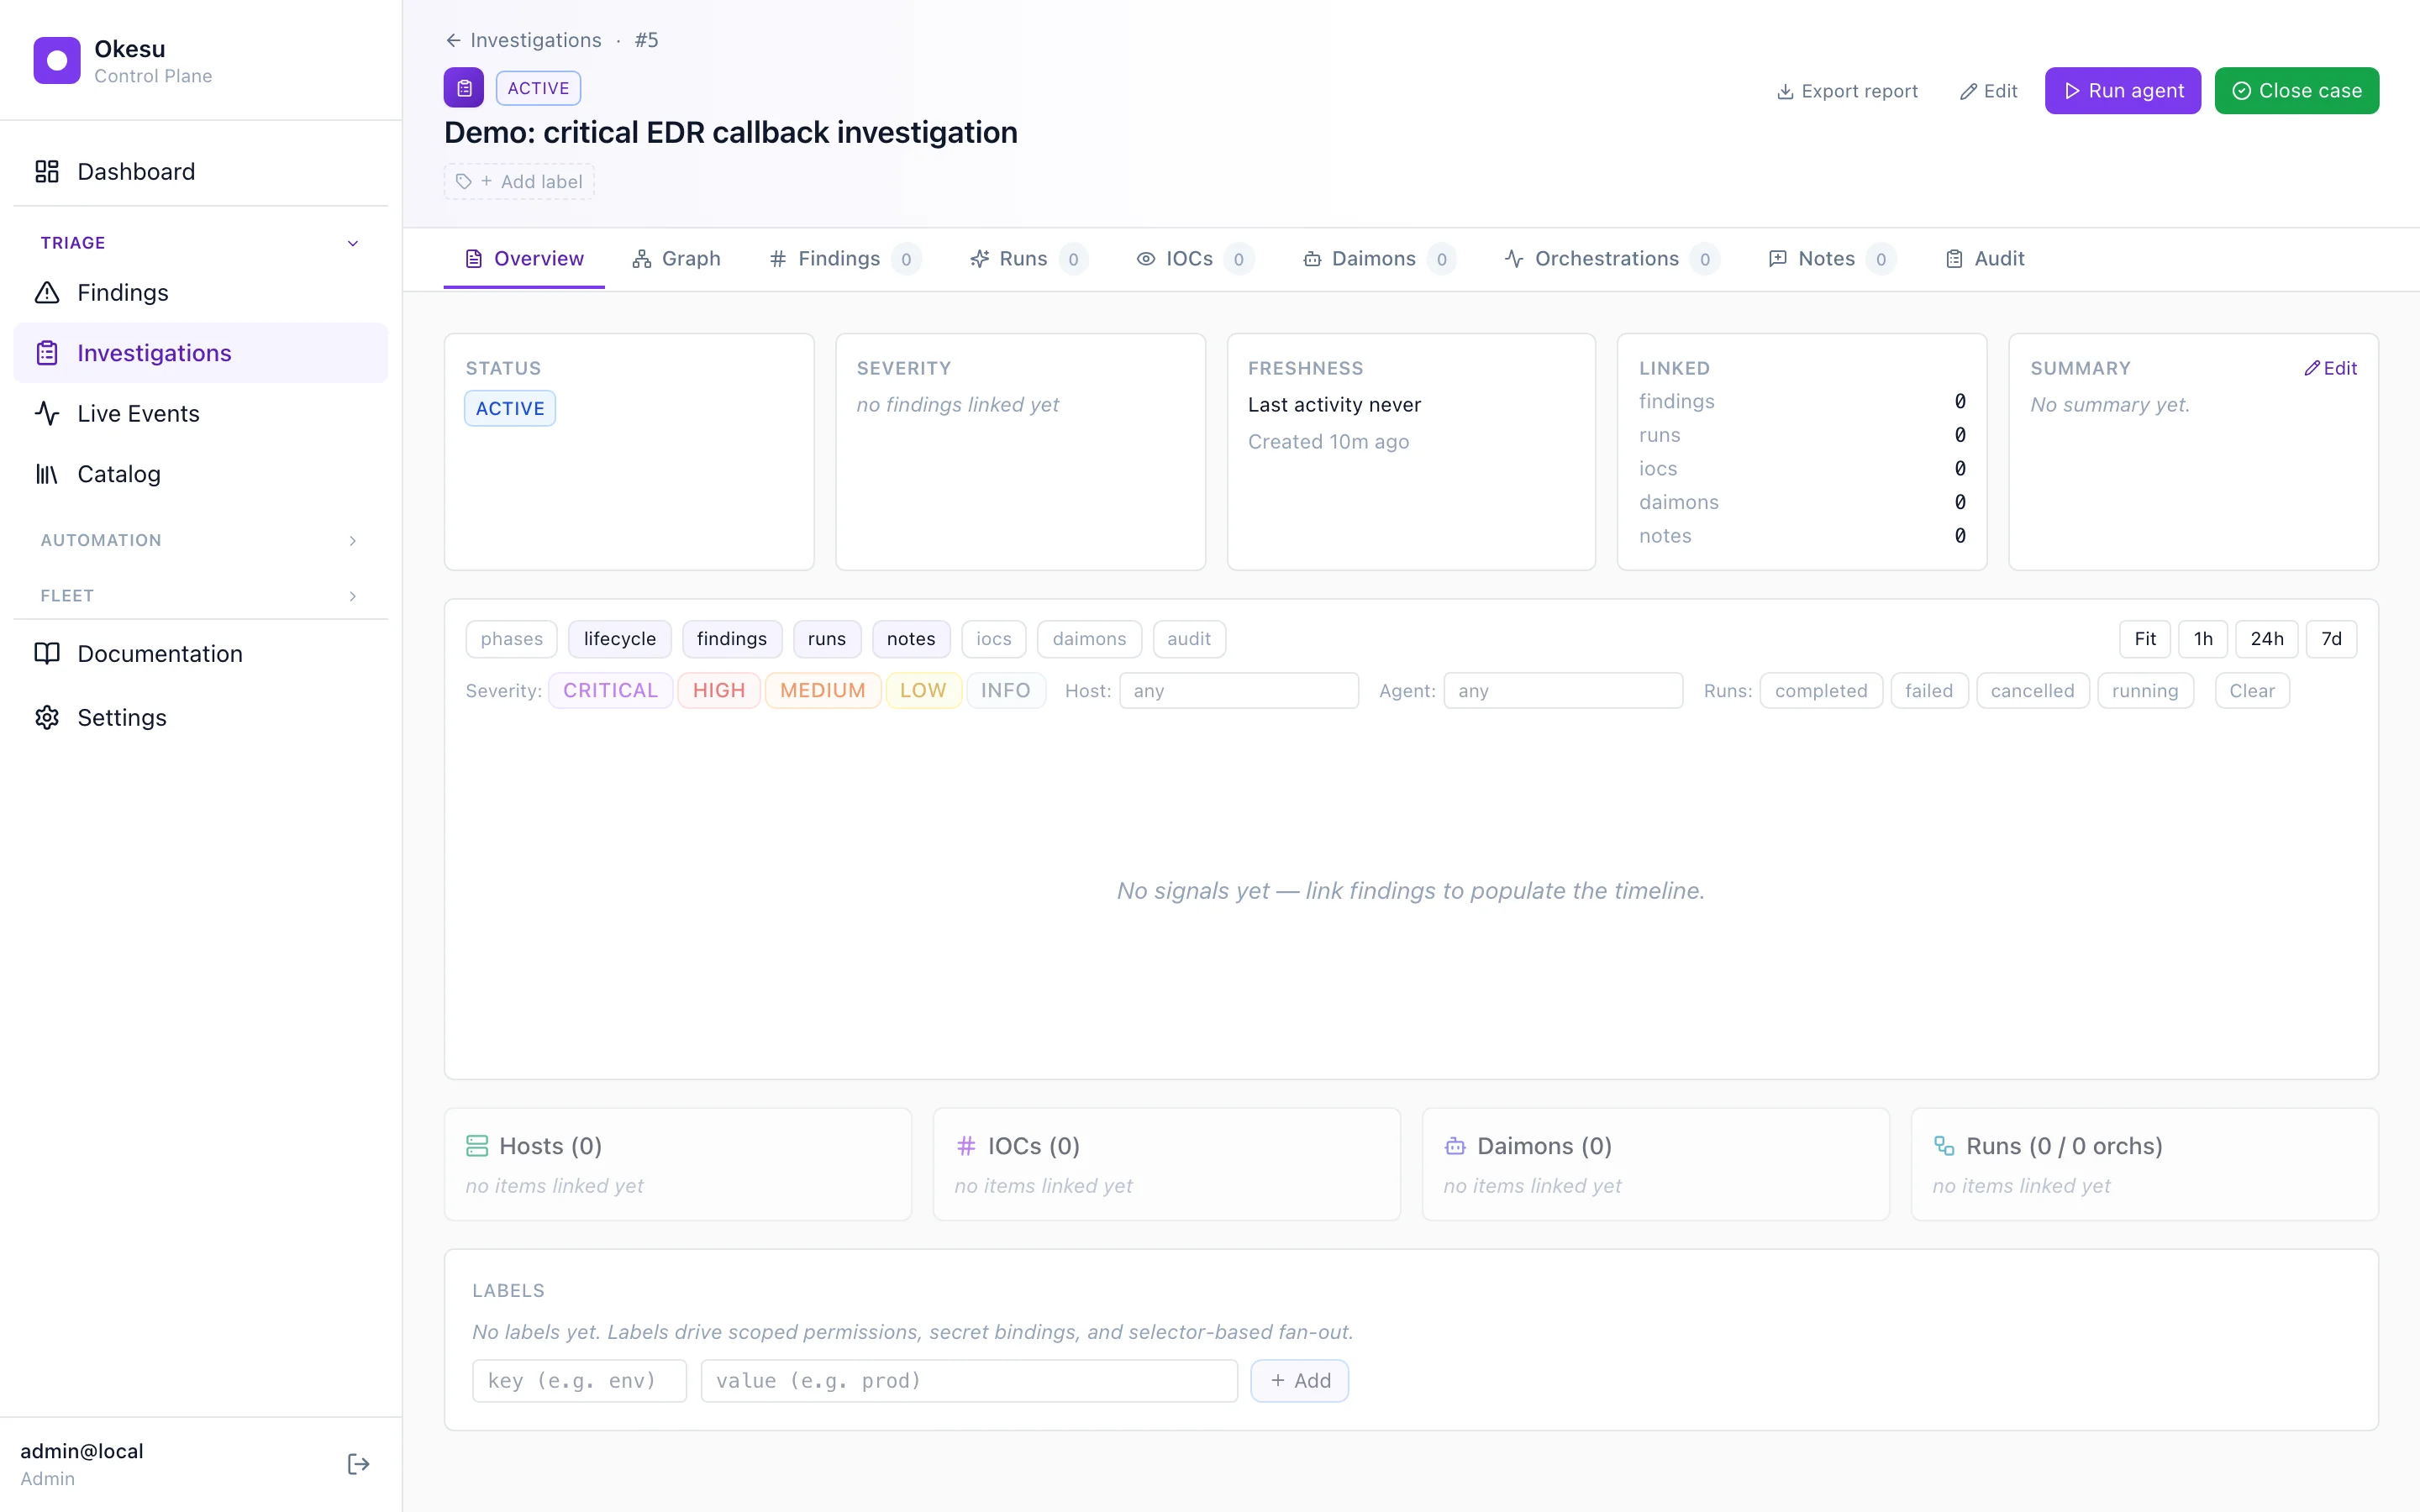
The case detail header — status, summary cards, and the eight tabs (Overview, Timeline, Graph, Findings, Runs, IOCs, Daimons, Notes, Audit).
Timeline
The Timeline tab is a horizontal lane view of everything that’s happened in the case. Findings dots, run bars, IOC markers, daimon ticks, and notes — all drawn against the same time axis. A filter bar at the top lets you scope by severity, run-status, host, or agent. Saved searches let you stash a particular slice and come back to it.
For long-running cases, an outlier-resistant autoFit keeps the most active cluster of events visible without zooming you out to a useless bird’s-eye view.

The timeline view, filtered to severity ≥ HIGH and run-status = approved.
Graph view
The Graph tab renders the case’s relationships as a bipartite layout — hosts on one side, IOCs on the other, edges showing which host saw which IOC. Hover an edge to see when and how the relationship was established (which finding observed it, which run confirmed it).
The data comes from a server-side aggregation endpoint (/api/investigations/{id}/structure) — the CP rolls up host/IOC/daimon/run counts so the frontend doesn’t have to walk the entity graph itself.
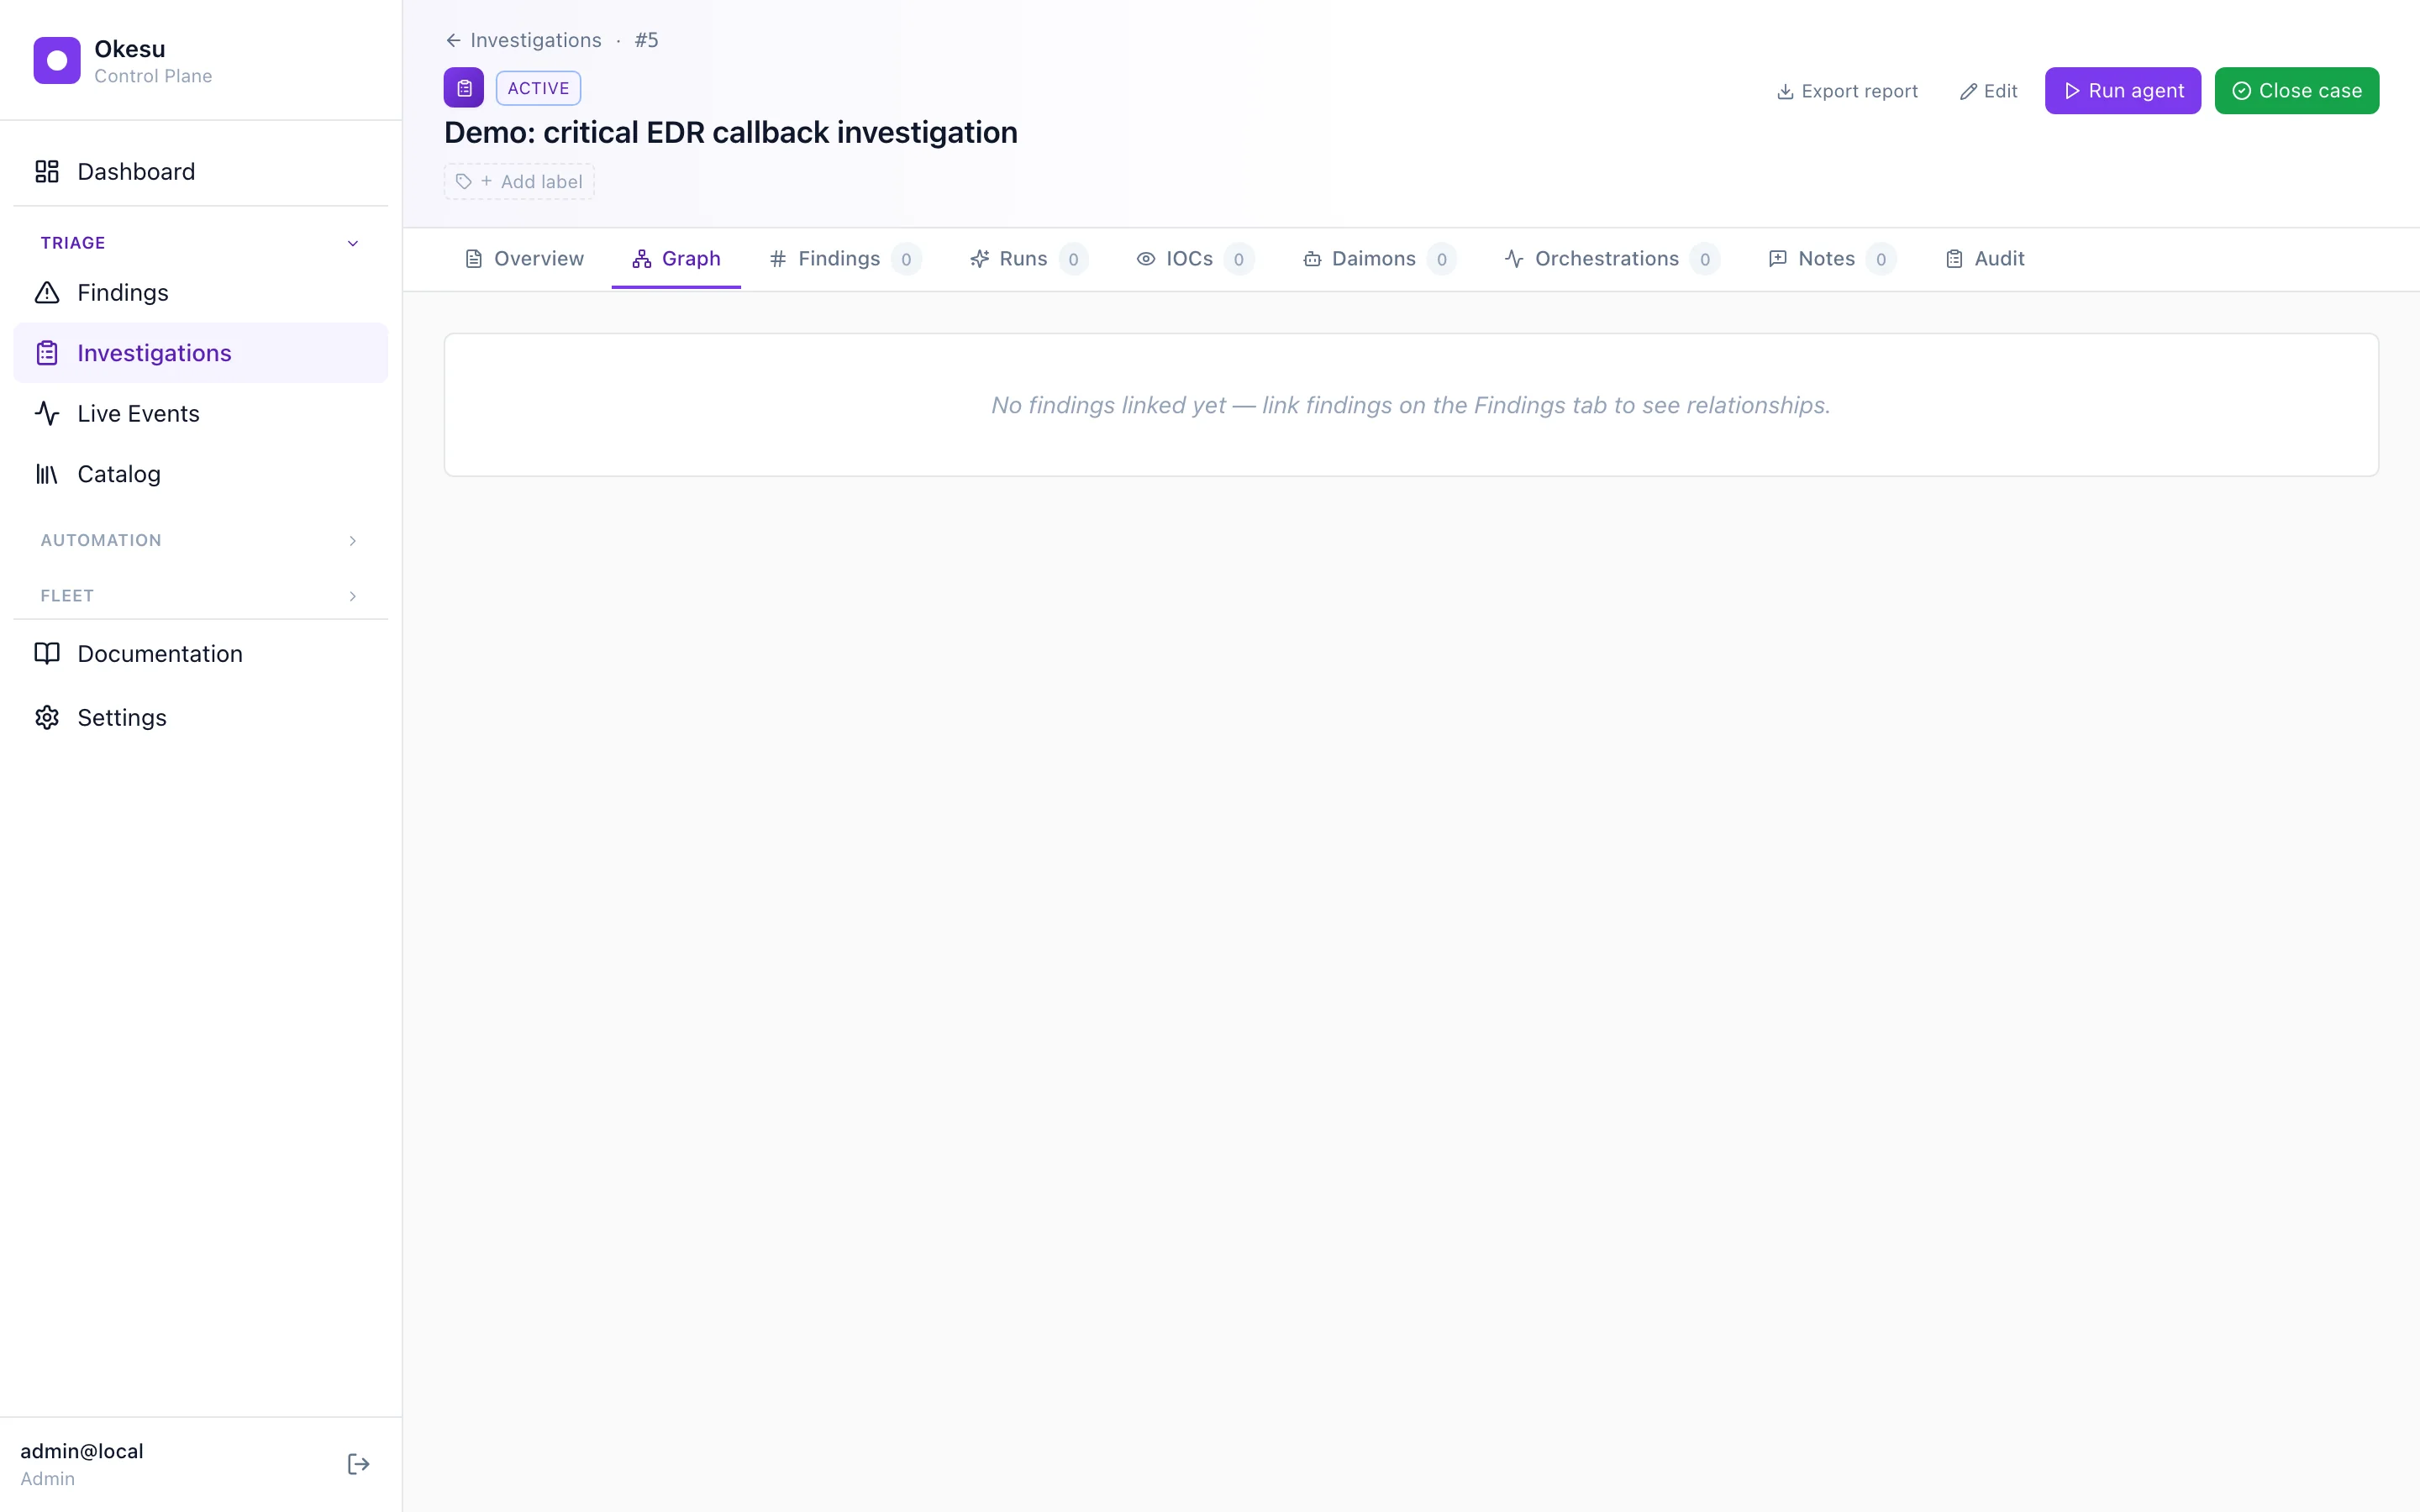
The graph view — hosts on the left, IOCs on the right, relationships as edges.
War room
When two or more operators are working a live incident, the war room gives them a shared draft buffer to think out loud together. Open the war room from the case detail page; everyone connected sees each other’s cursors, types into the same textarea, and reads each other’s contributions in real time.
Under the hood it’s a Yjs CRDT — operations are eventually consistent across all clients with no central serialiser, so a brief network blip doesn’t lose anyone’s input. The CP runs a thin relay that forwards Yjs sync messages between connected clients and persists the snapshot every five seconds.
When the team’s done thinking, one operator hits Send and the current draft becomes one immutable InvestigationNote row — preserving the existing audit chain. The simple-note path stays available for quick comments; the war room is the right tool when multiple people need to think together.

A war-room session in flight: two operators editing the same buffer, presence chips up top, Send produces one note row.
PDF report
One click, one PDF. The report stitches together the case’s executive summary, the chronological narrative, every linked finding/IOC/run/audit-event, and a final reference table — formatted for the kind of stakeholder who’ll never log into Okesu.
The report endpoint is federated: a parent CP serves a report for a child’s case by proxying the request through the federation token. A consistent header/footer frame and page numbering keep the document stakeholder-ready.

Page one of the export — executive summary plus key counts.
Where to next
- Orchestrations — runs hang off cases; an orchestration’s run-detail links back to its case.
- Daimons — continuous monitoring is what produces the findings cases get built around.
- Recipes — every recipe on the playbook list is the kind of run that ends up linked to an investigation.