The dashboard at a glance
You walk in and the CP shows you the state of the fleet. Federated CPs at the top (this one aggregates 2/2 children), counts of daimons heartbeating, finding queues stratified by severity, and chart strips for events / severity / automation runs over the last 24 hours.
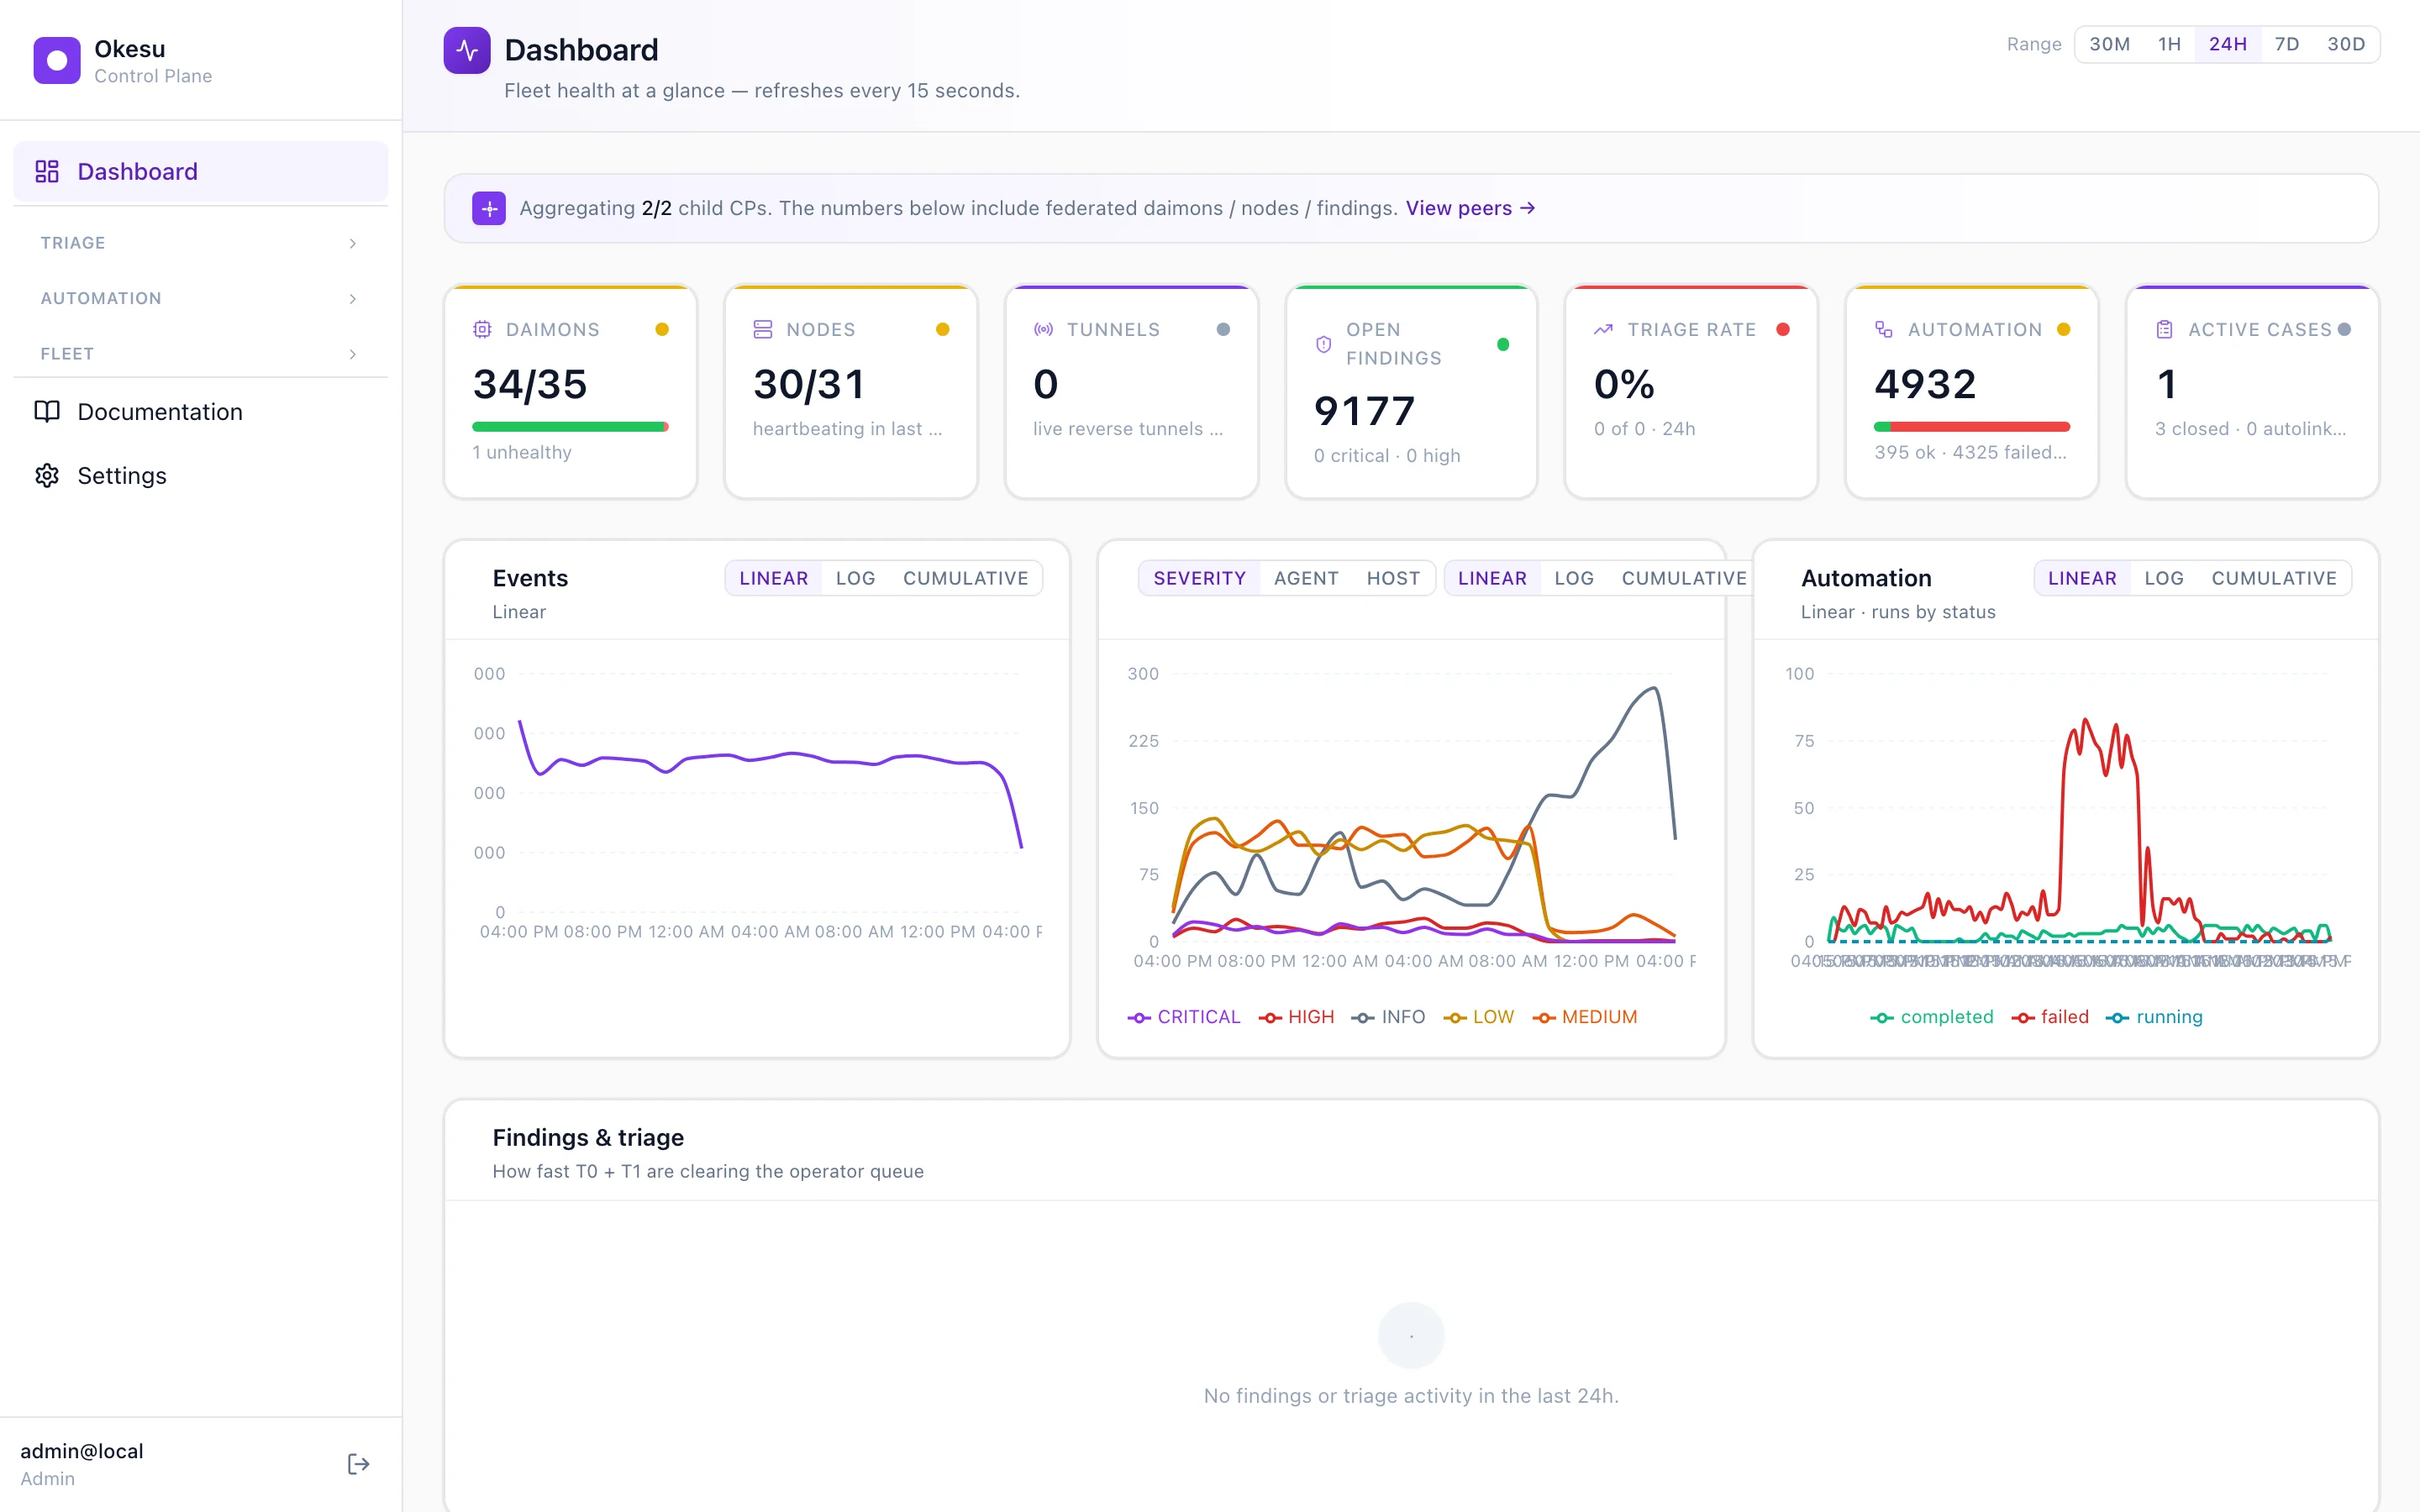
The dashboard at a glance — federated, refreshes every 15 seconds.
A finding lands
Your sre-health daimons across the fleet detect a connection-failed pattern hitting your public health endpoints. They emit one finding each. The Findings page bundles them by severity and clusters by IOC; you see 761 CRITICAL open across 9,381 total. The first row is what fired most recently.
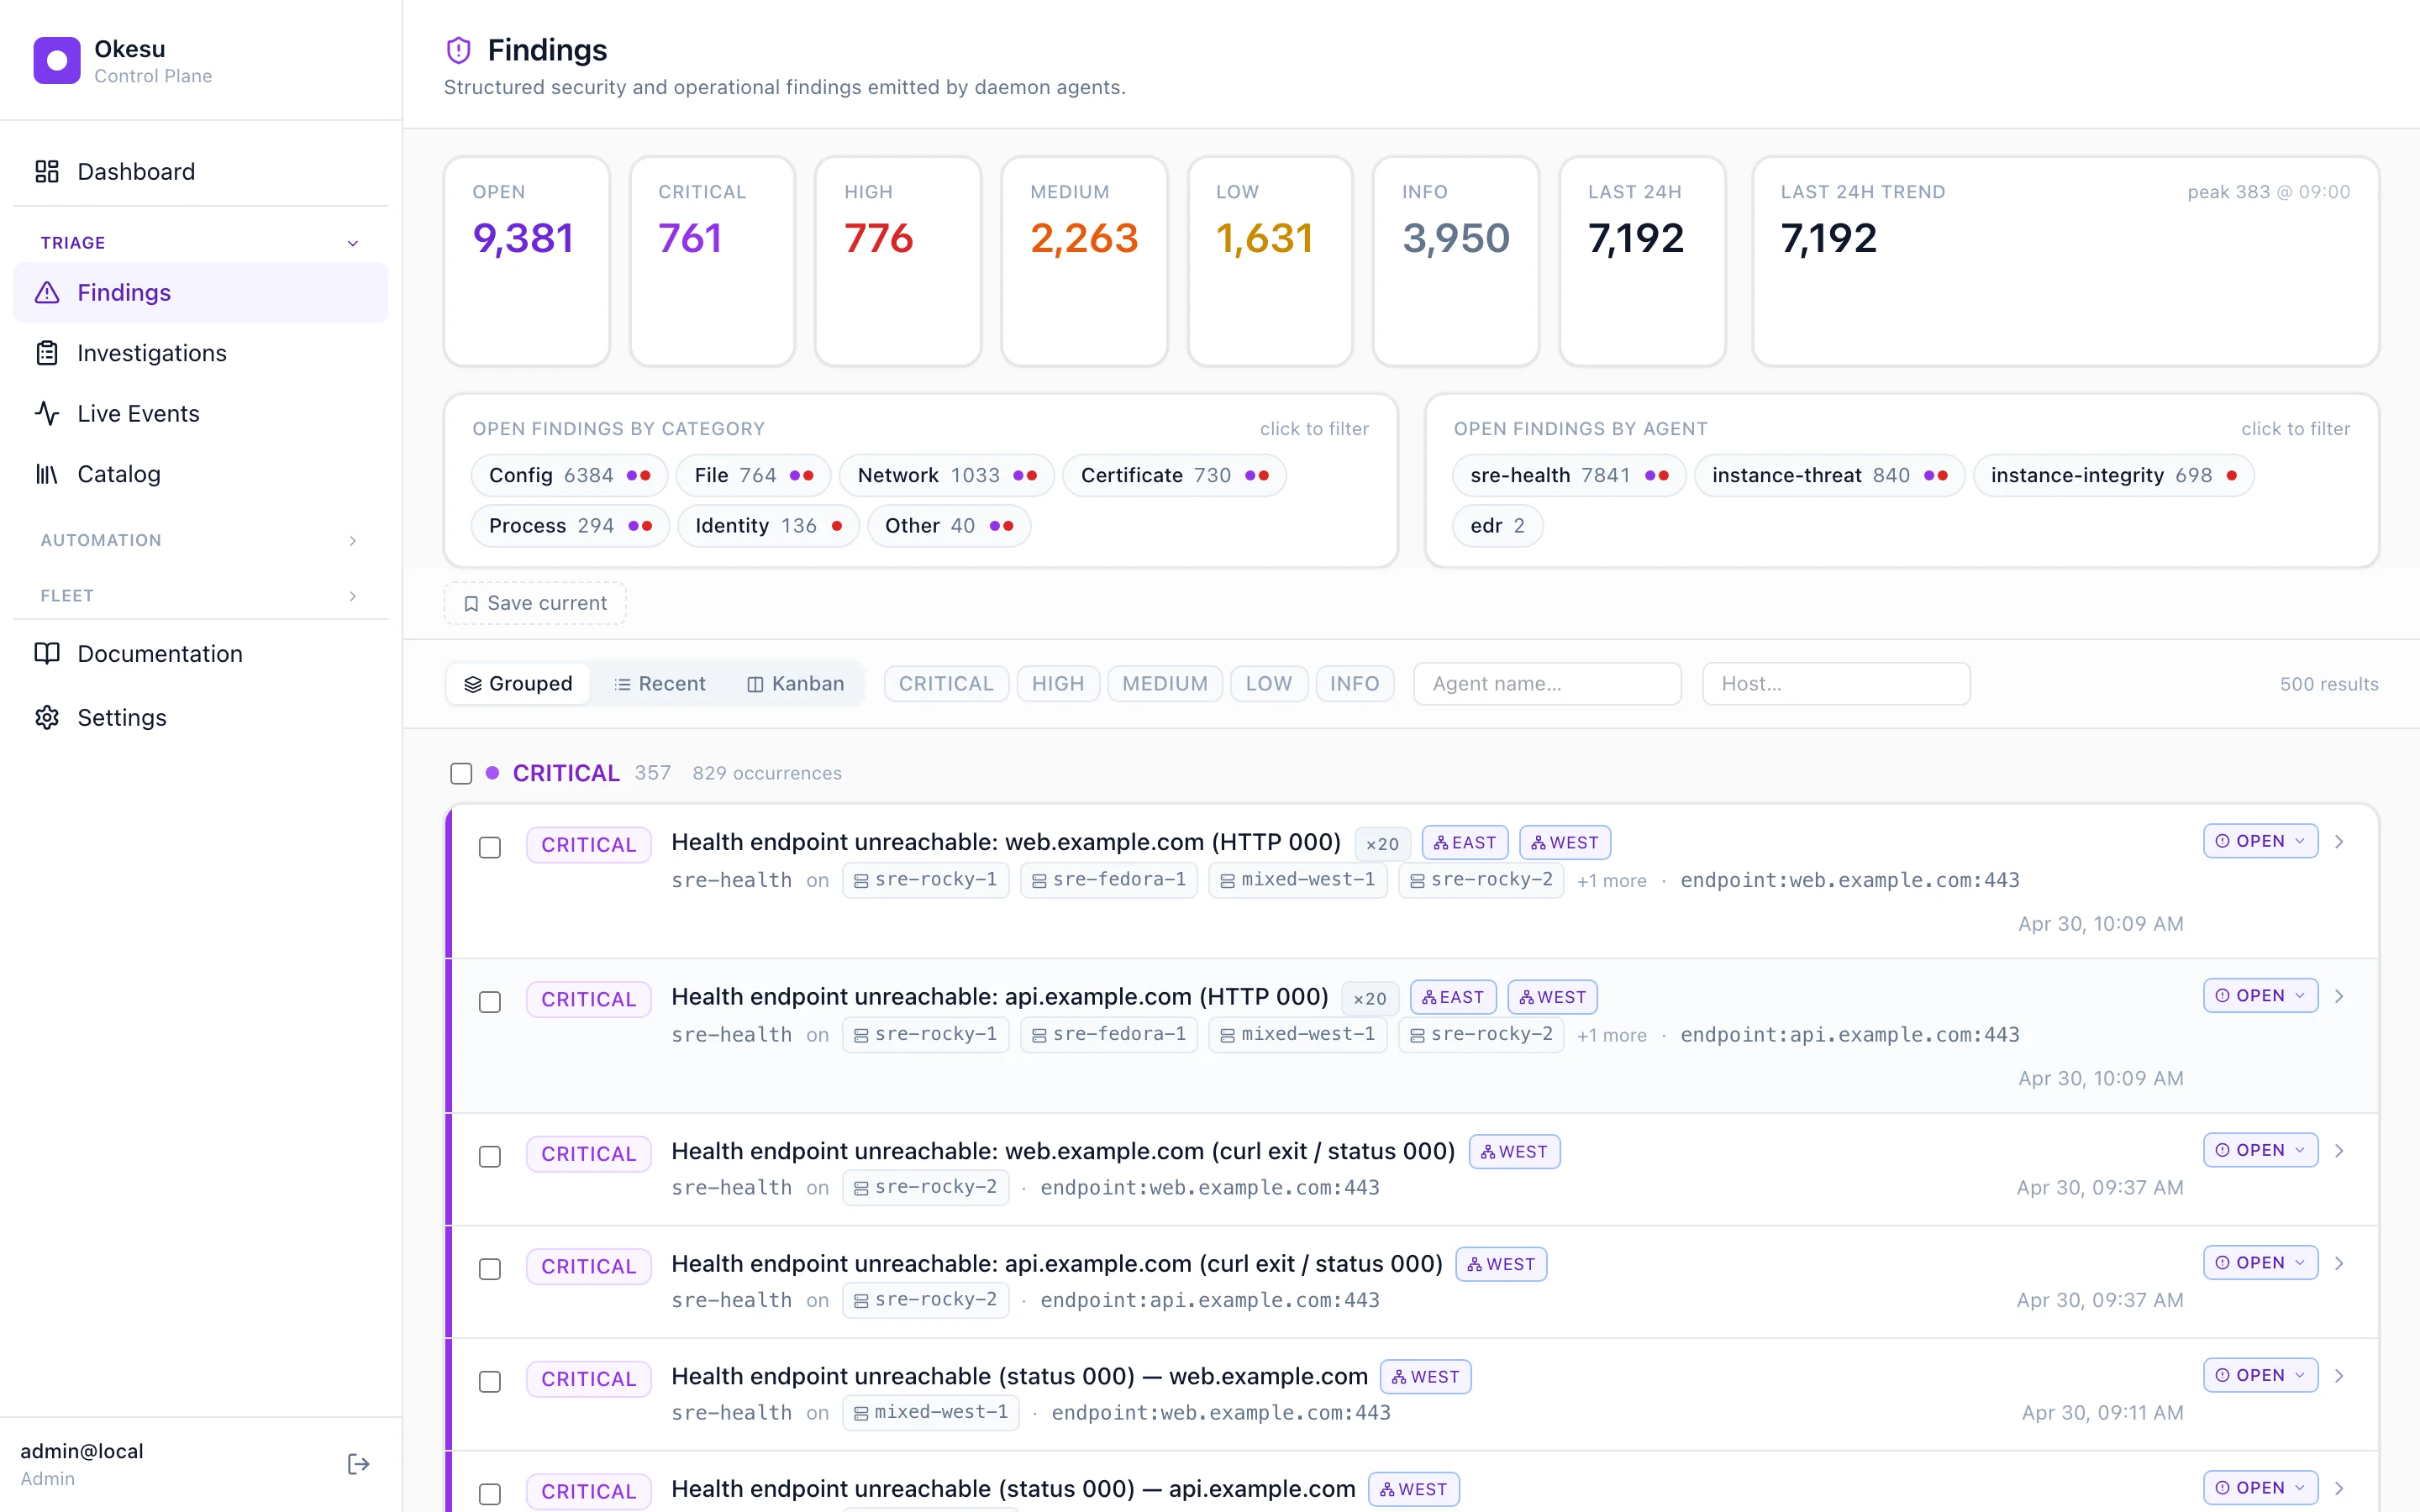
Findings emitted by daimons across the fleet.
Reach for a playbook
You don't triage by hand. The Orchestrations library is the catalog of playbooks already authored on this CP — drift remediation, login-noise dedup, fleet IOC hunts, cert rotations, the EDR critical-response we walked through on the recipes page. Each one has its trigger filter visible at the top; many fire automatically when a matching finding lands.
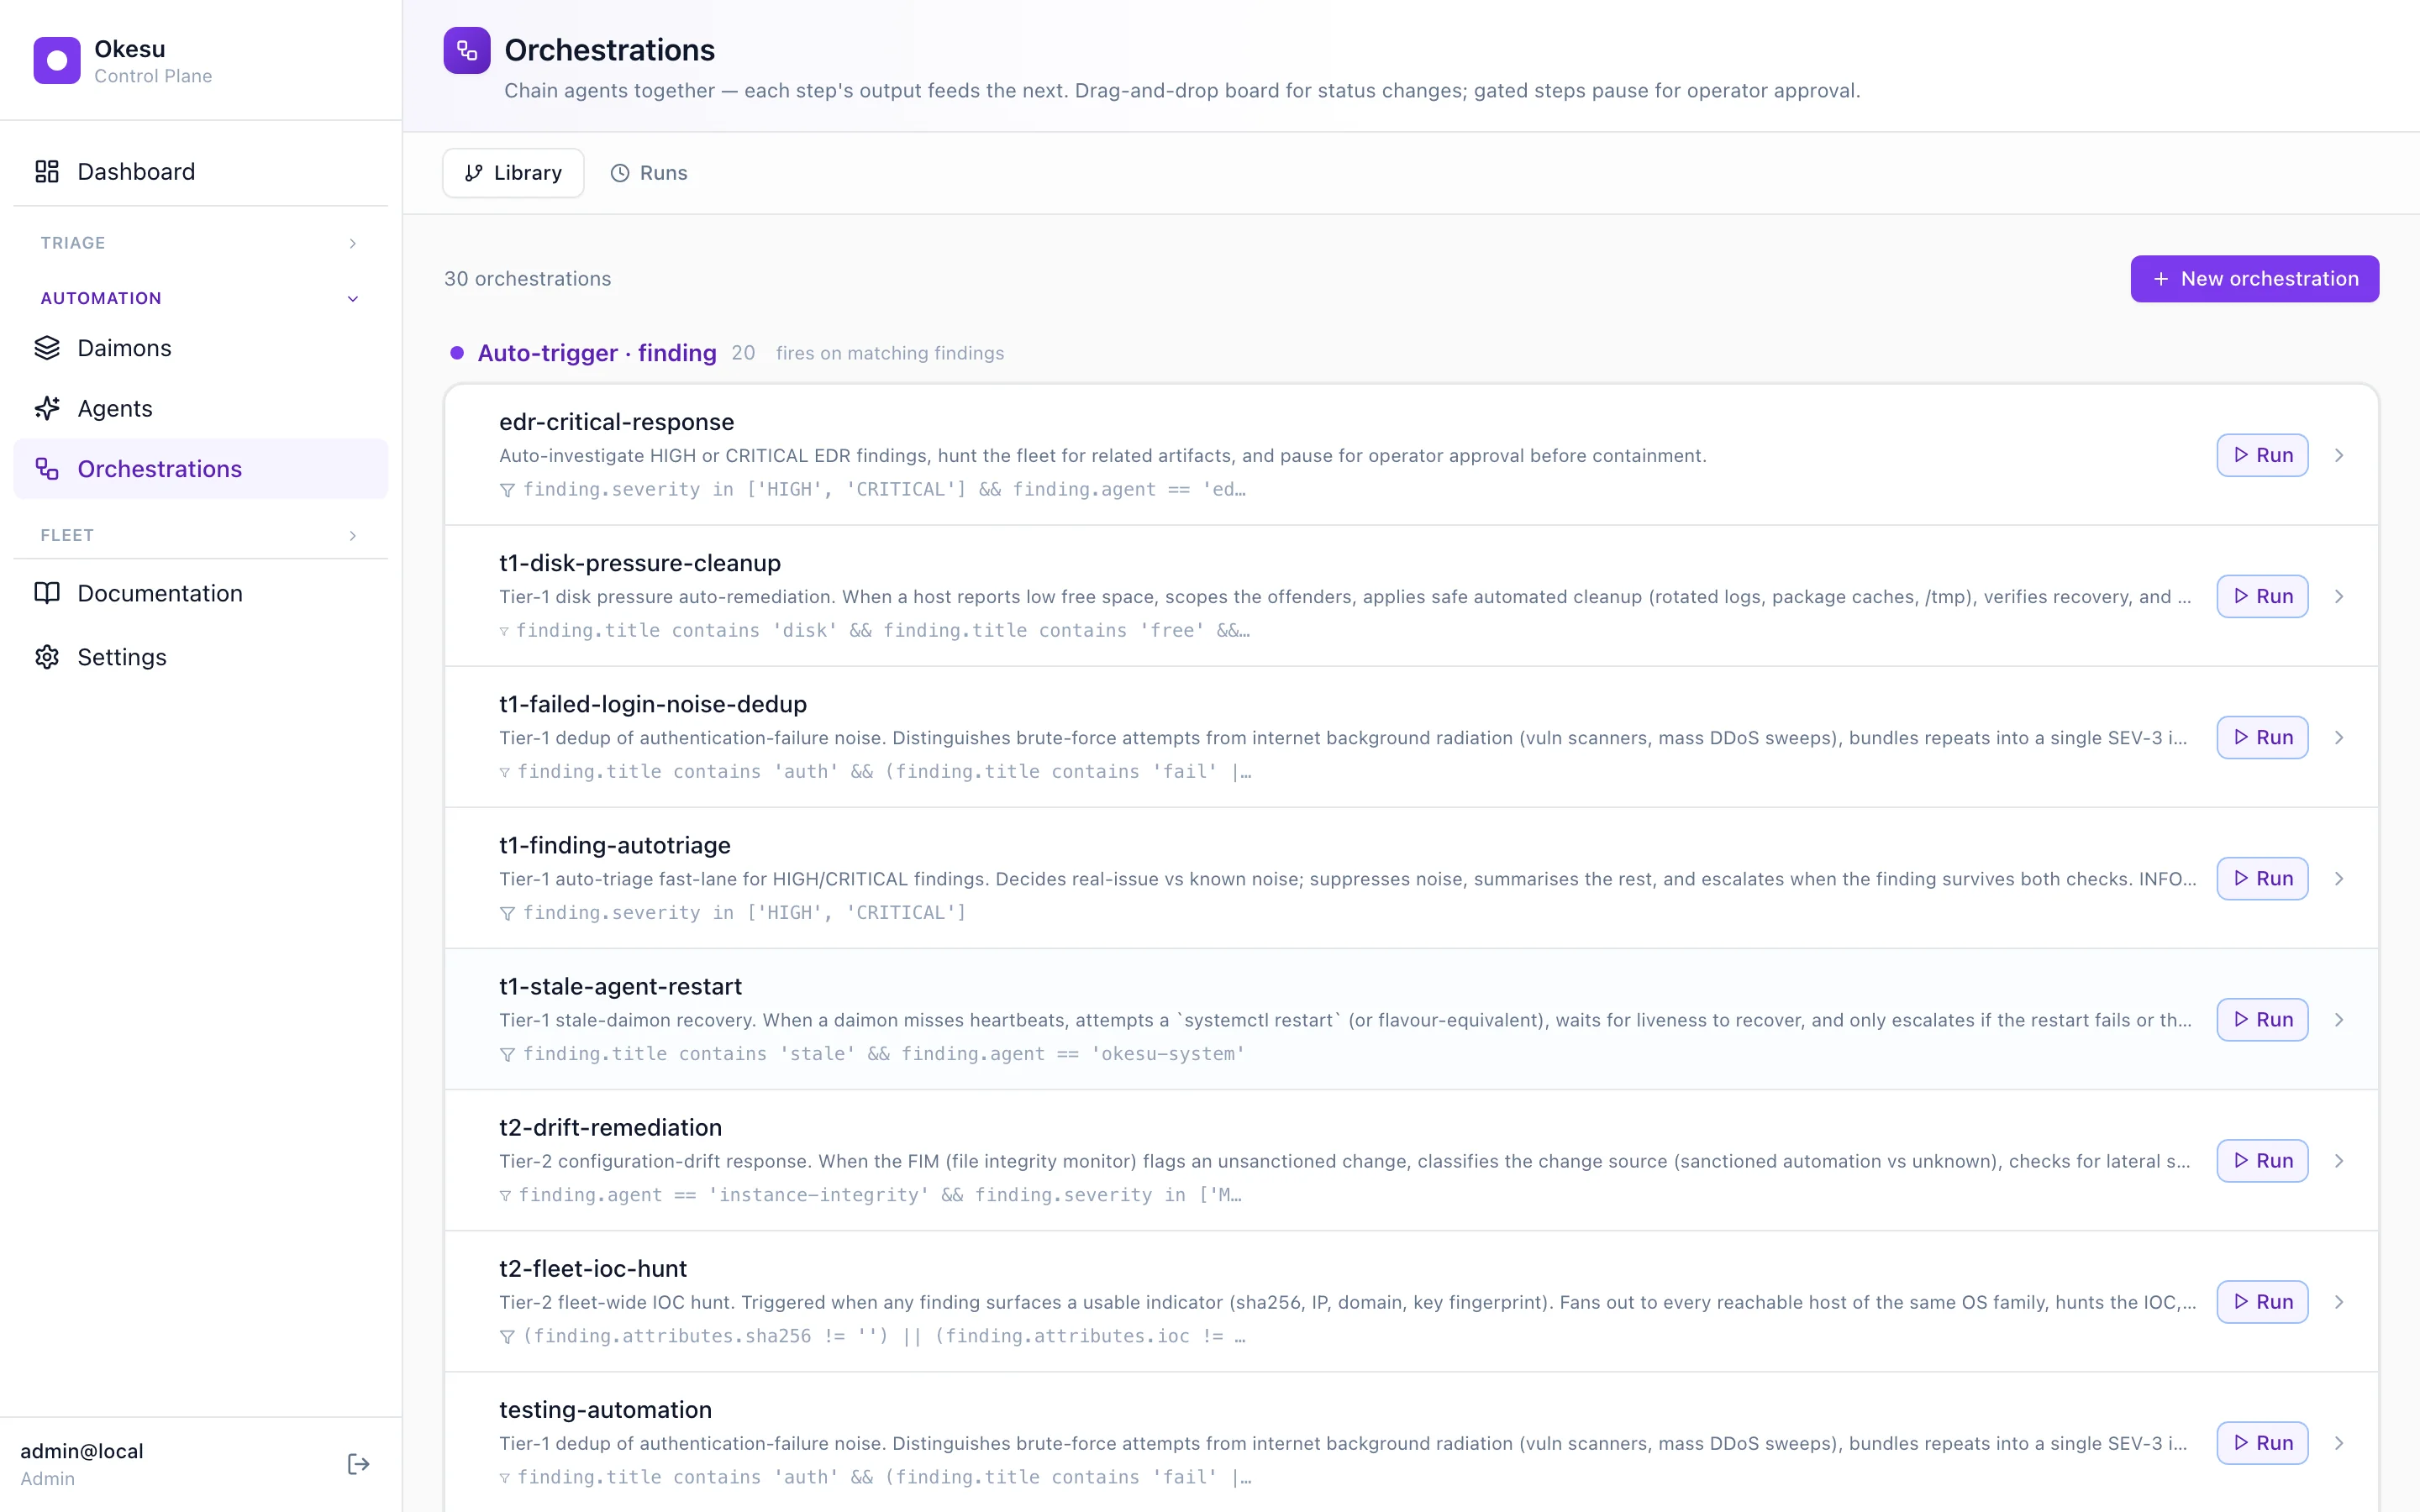
The playbook library — auto-trigger filters at the top, manual Run buttons on the right.
The spec, visualised
Click into edr-critical-response and the editor renders the YAML spec as a directed graph. Agents on the left palette; the DAG in the middle. Notice the third step has a brand-purple border and reads FAN-OUT · 3 HOSTS — that's the engine telling you it'll dispatch on three hosts in parallel. The fourth step reads GATED in amber — the run will pause there until you approve it.
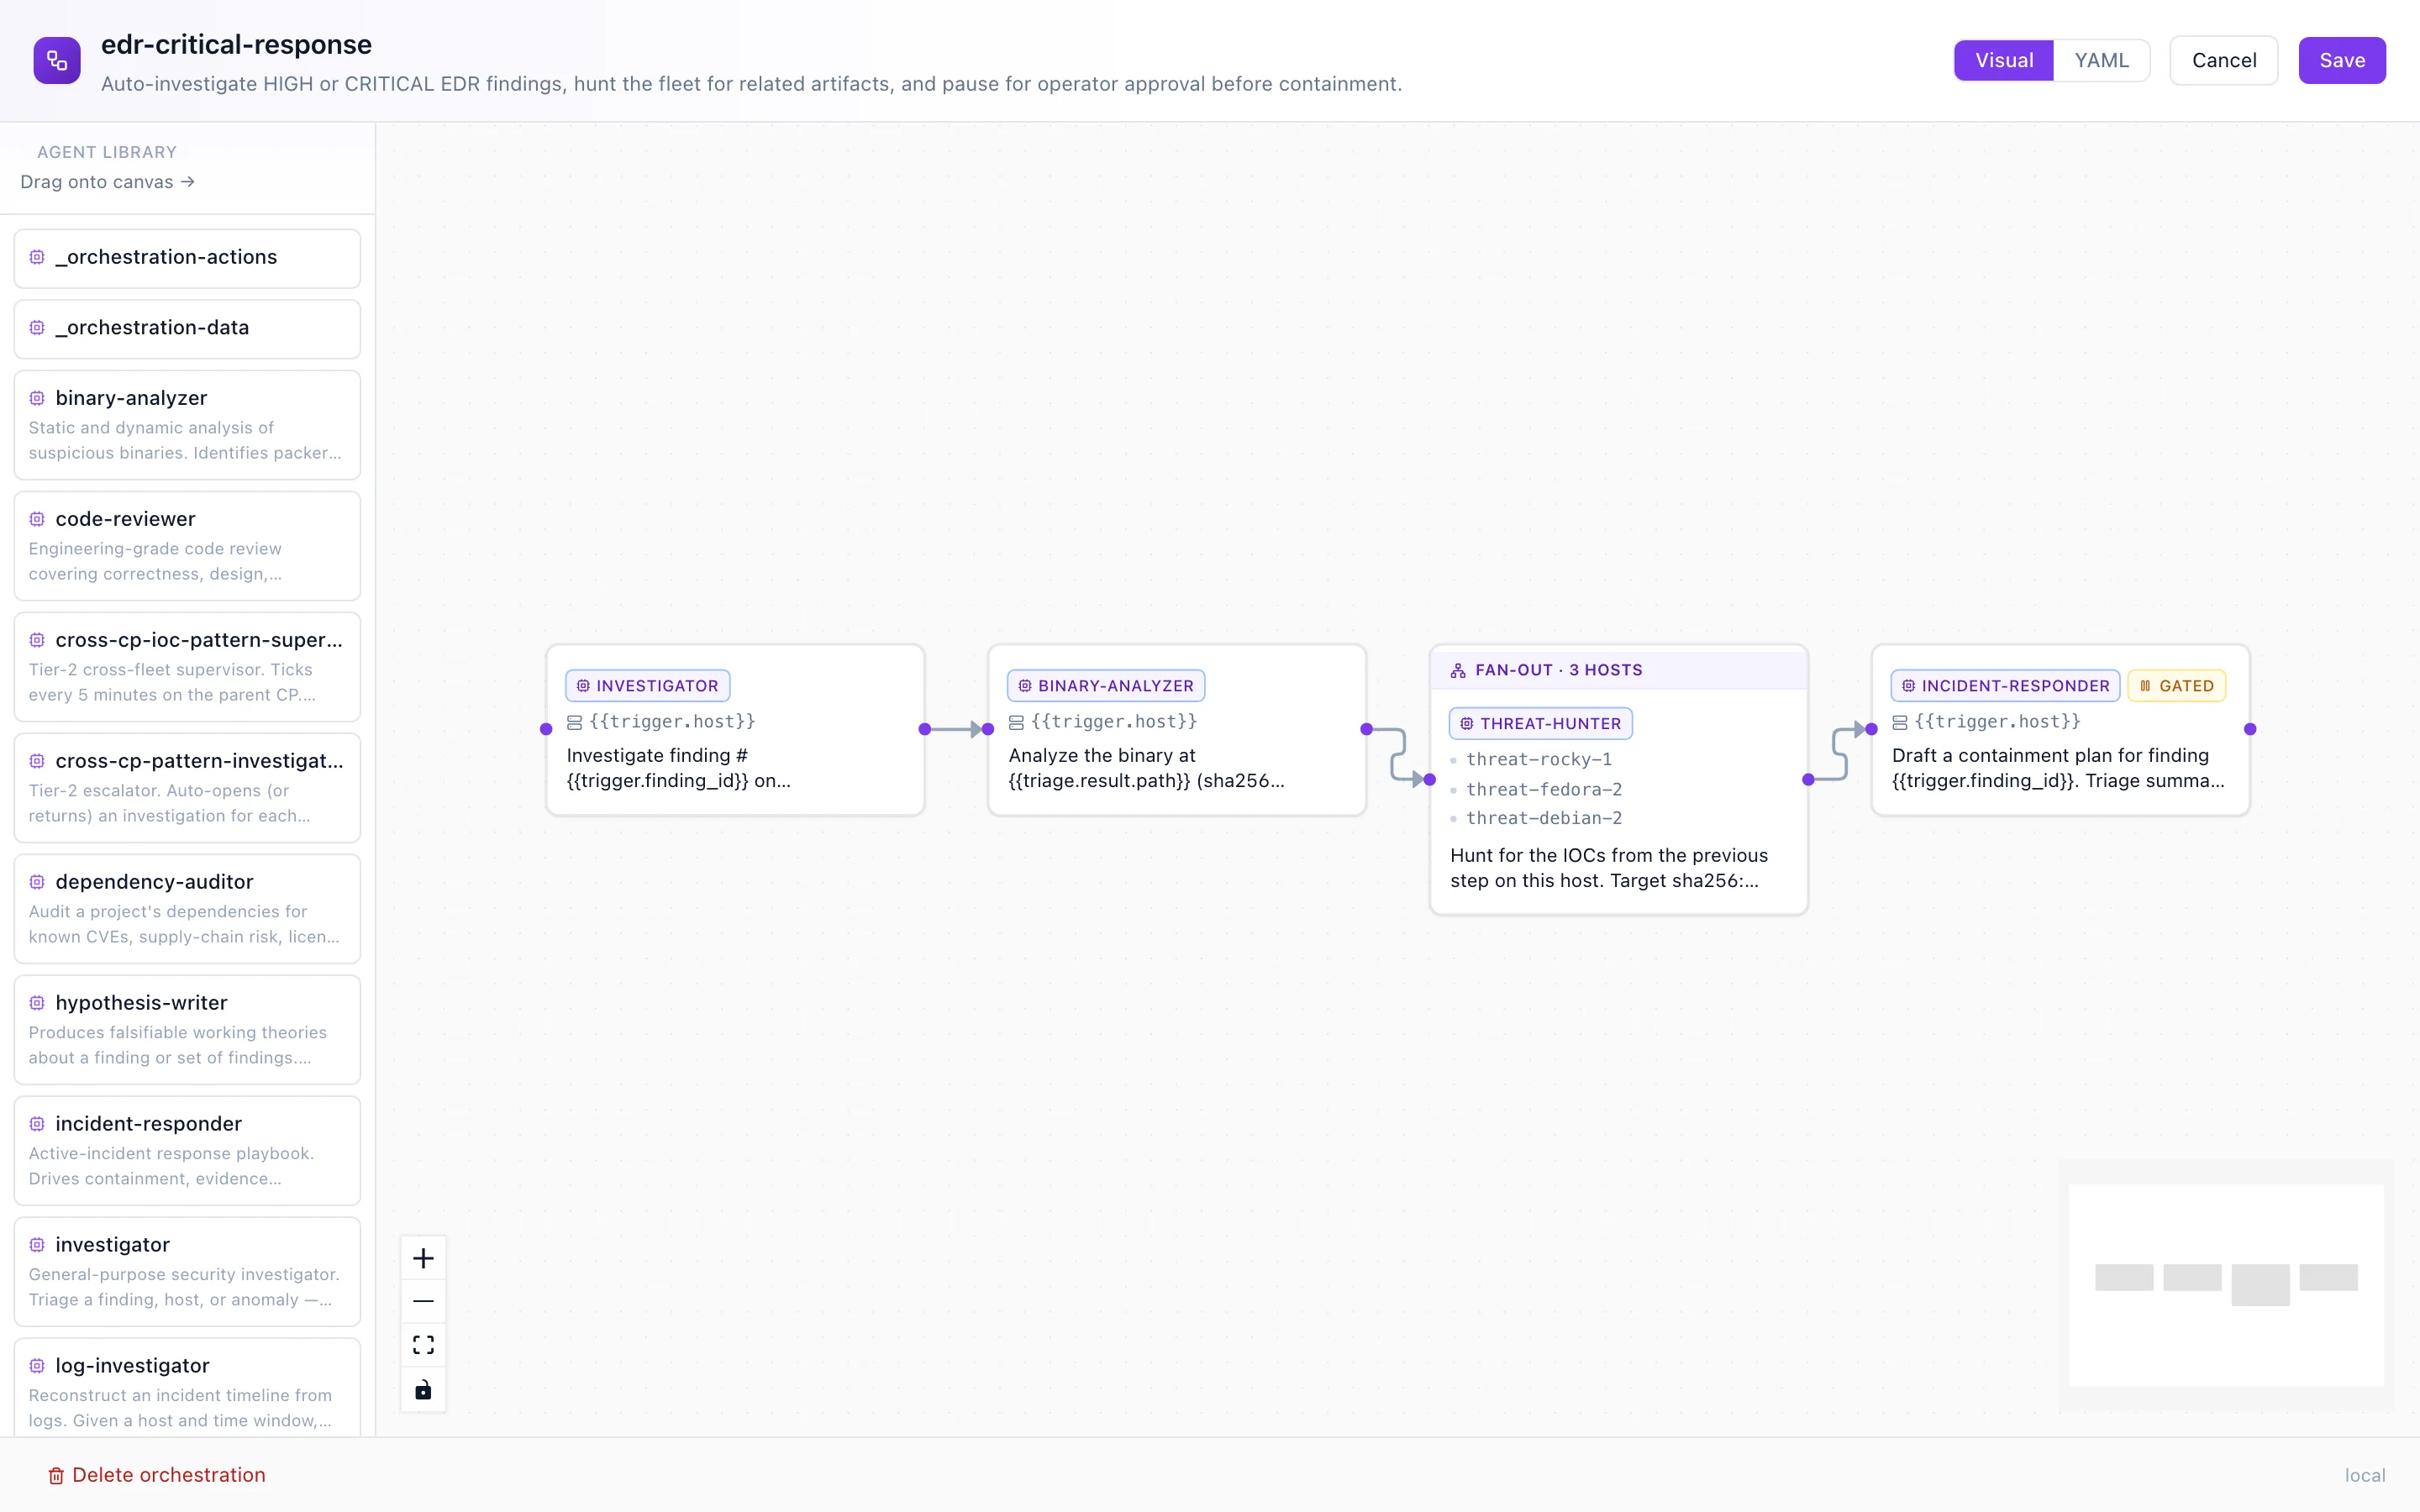
The spec, made visible. Drag to add agents; the YAML and the canvas stay in lockstep.
Watch it run
Click Run. The CP dispatches step 1 immediately and the run-detail page lights up. The blue pulsing ring on triage is the platform's signal that this step is happening right now; the others sit pending. As each step settles you see the stripe color shift — slate (pending) to blue (running) to green (done) or red (failed). When a fan-out step kicks off, its card grows a per-host dot strip that fills in left-to-right as each host returns.
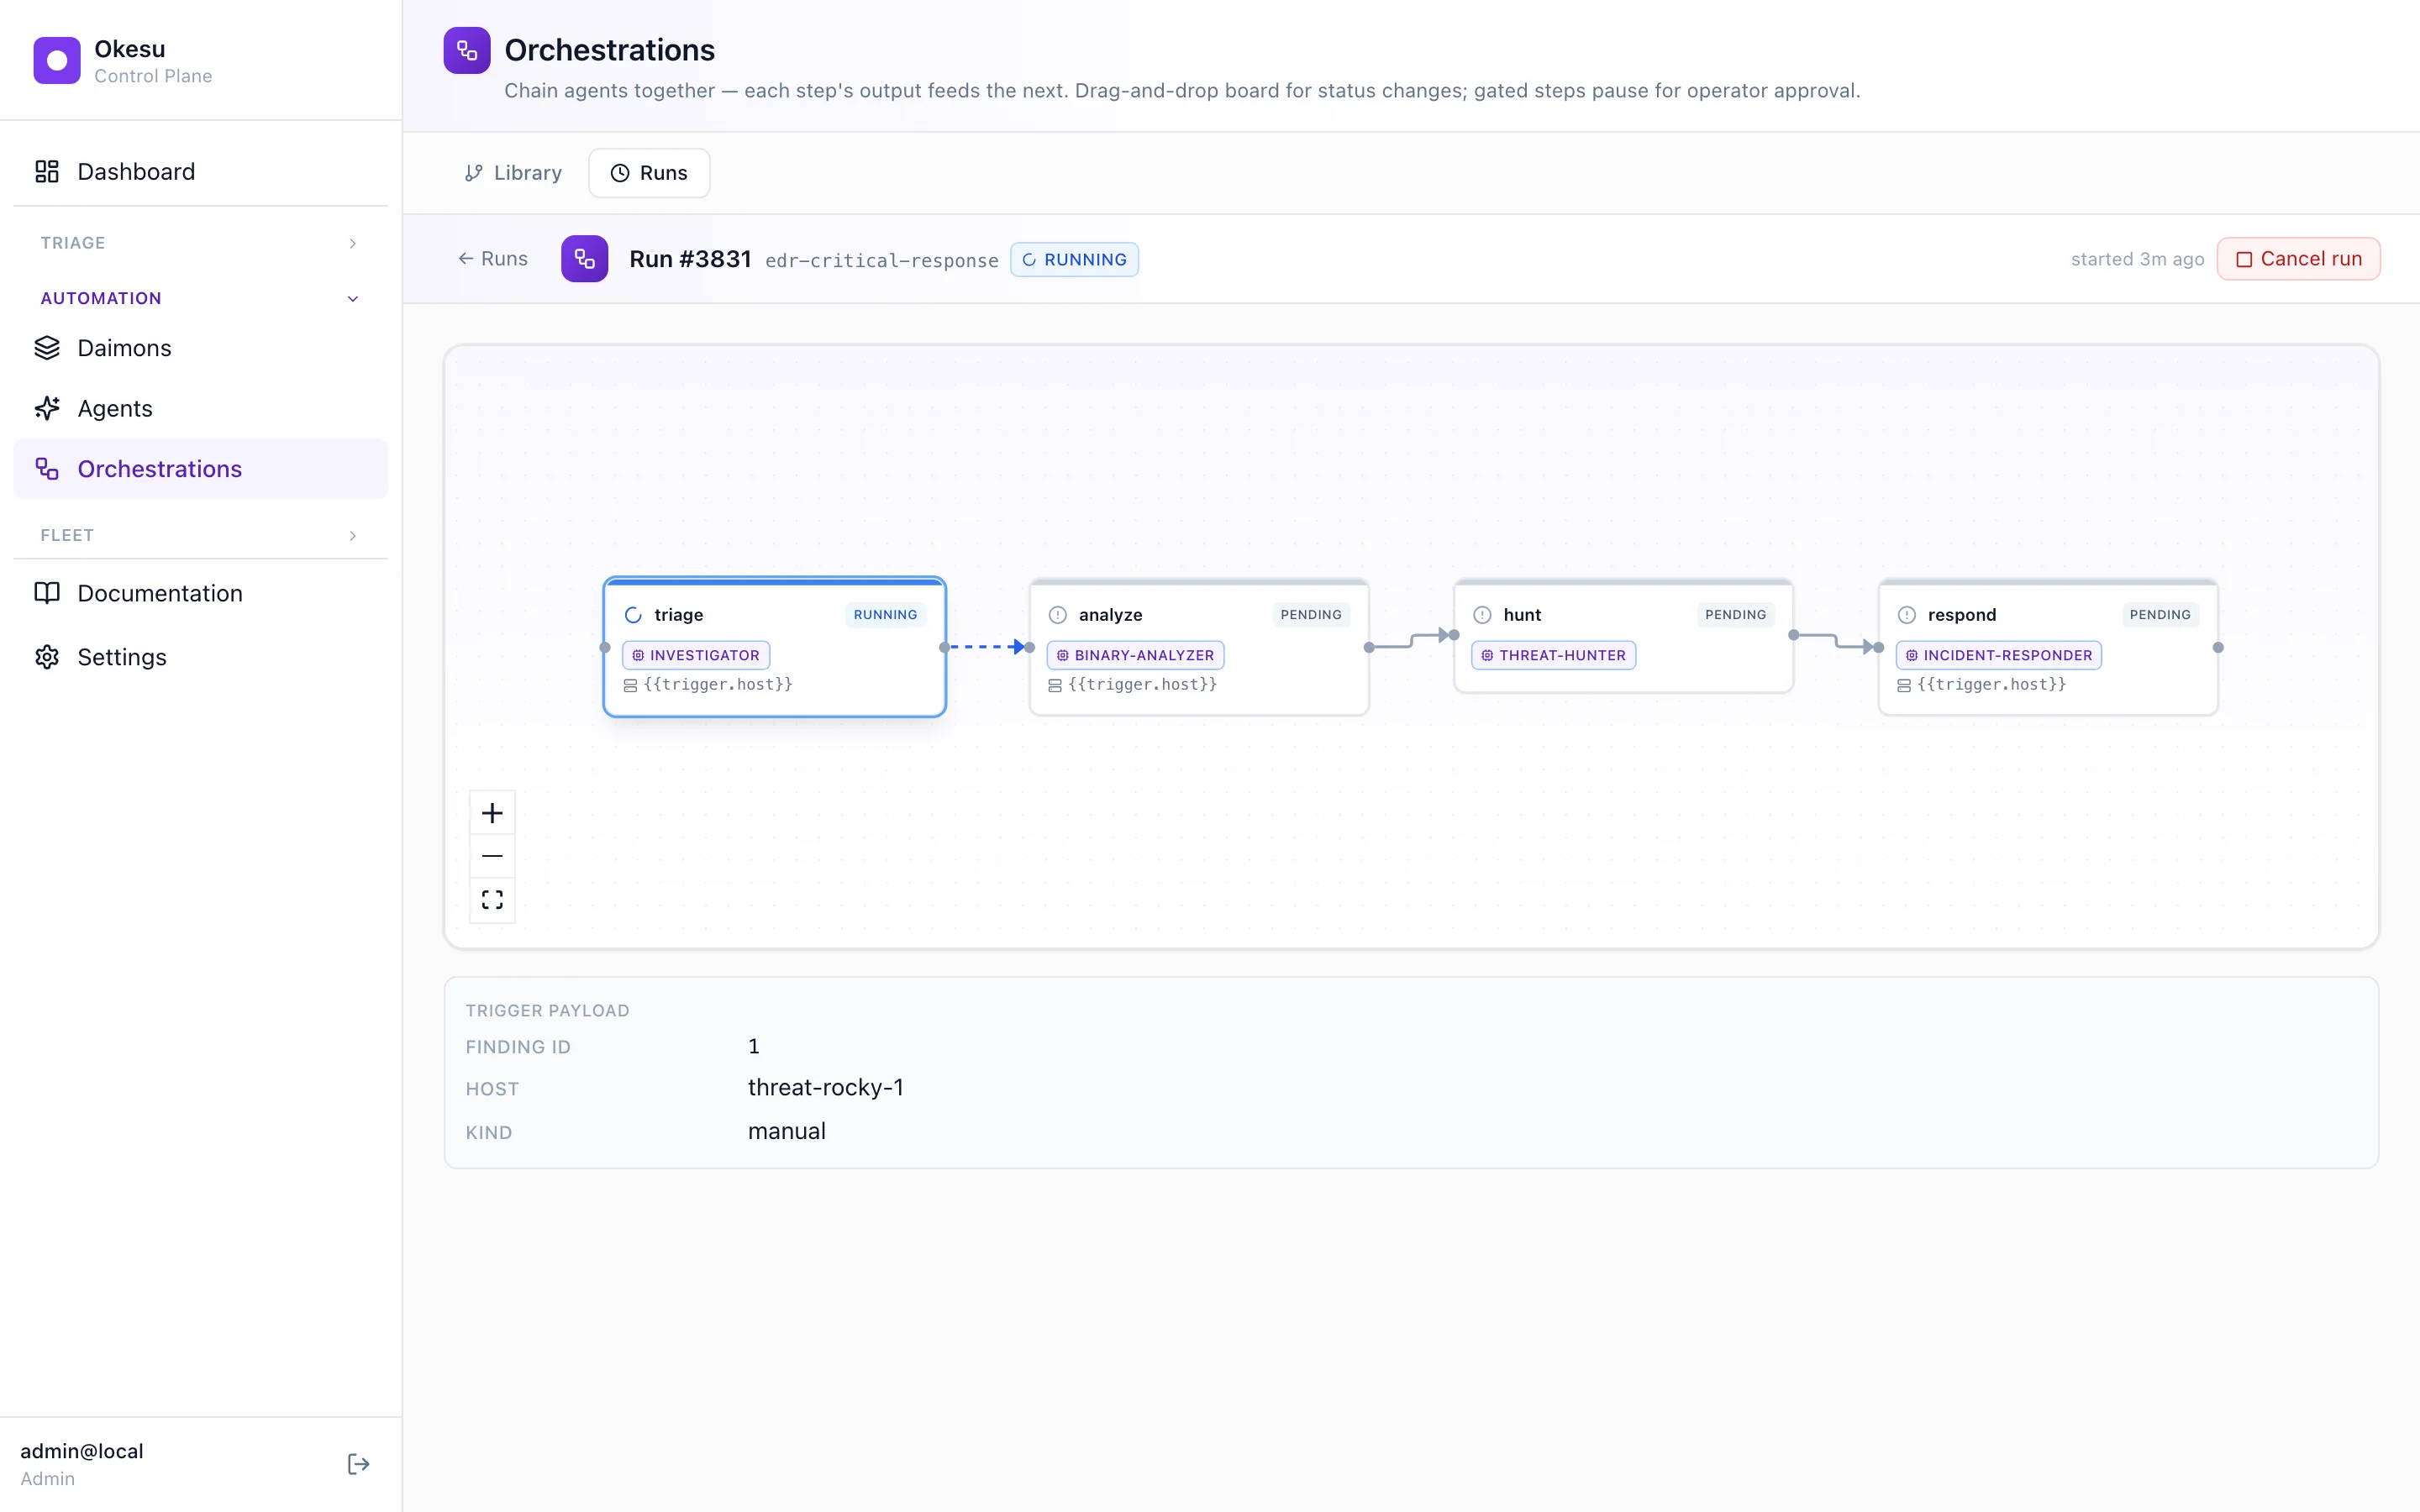
A run in progress. Triage running, the rest queued. Refreshes every 2.5 seconds.
The case file
When a finding gets serious enough — operator-confirmed, escalation-tagged, or matched by a cross-CP IOC supervisor — the platform creates an investigation. It's the case file that links the finding, the runs that worked it, the IOCs that match, the daimons reporting in, and your notes. One closed loop. Every action taken on the case lands on the Audit tab so the response is replayable.
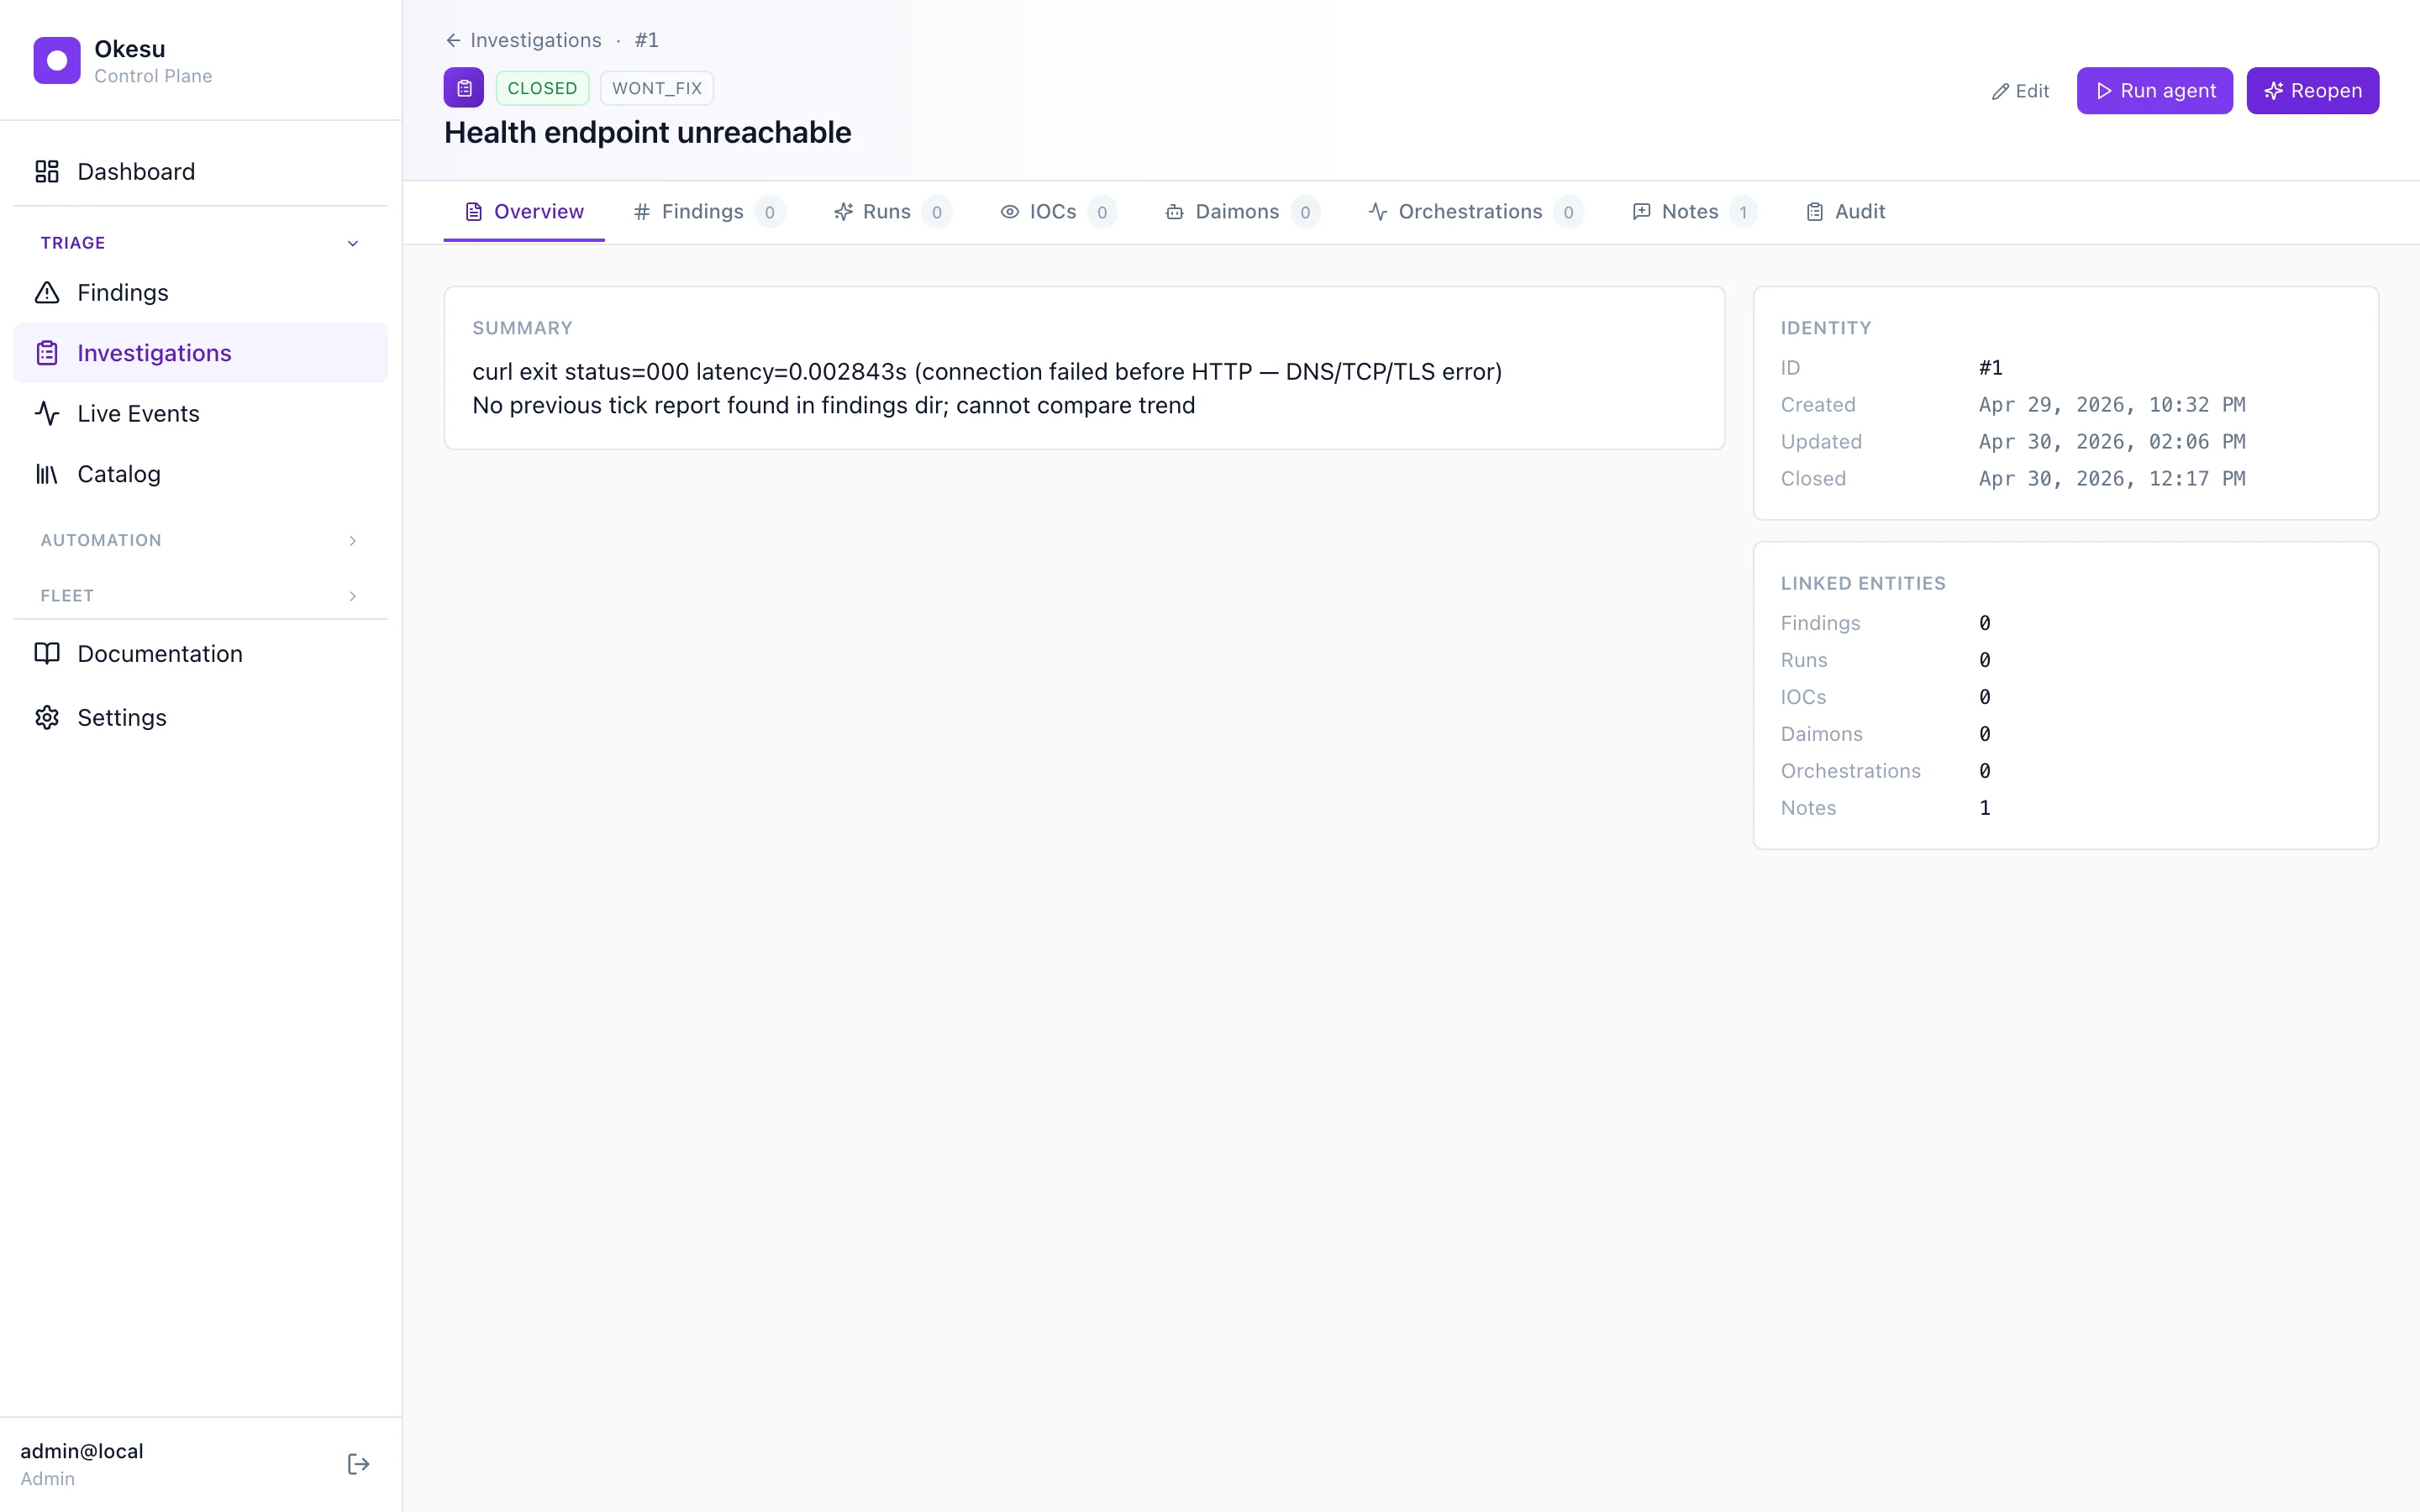
The case file shape: tabs across the top, identity + linked entities on the right. The next four screens walk through the tabs that do the actual work.
The timeline
The Timeline tab draws every event in the case against one shared time axis. Findings dots, run bars, IOC markers, daimon ticks — same axis, different lanes. The filter bar at the top scopes by severity, run status, host, and agent; saved searches stash a useful slice for next time. An outlier-resistant autoFit keeps the active cluster visible rather than zooming out to nothing.
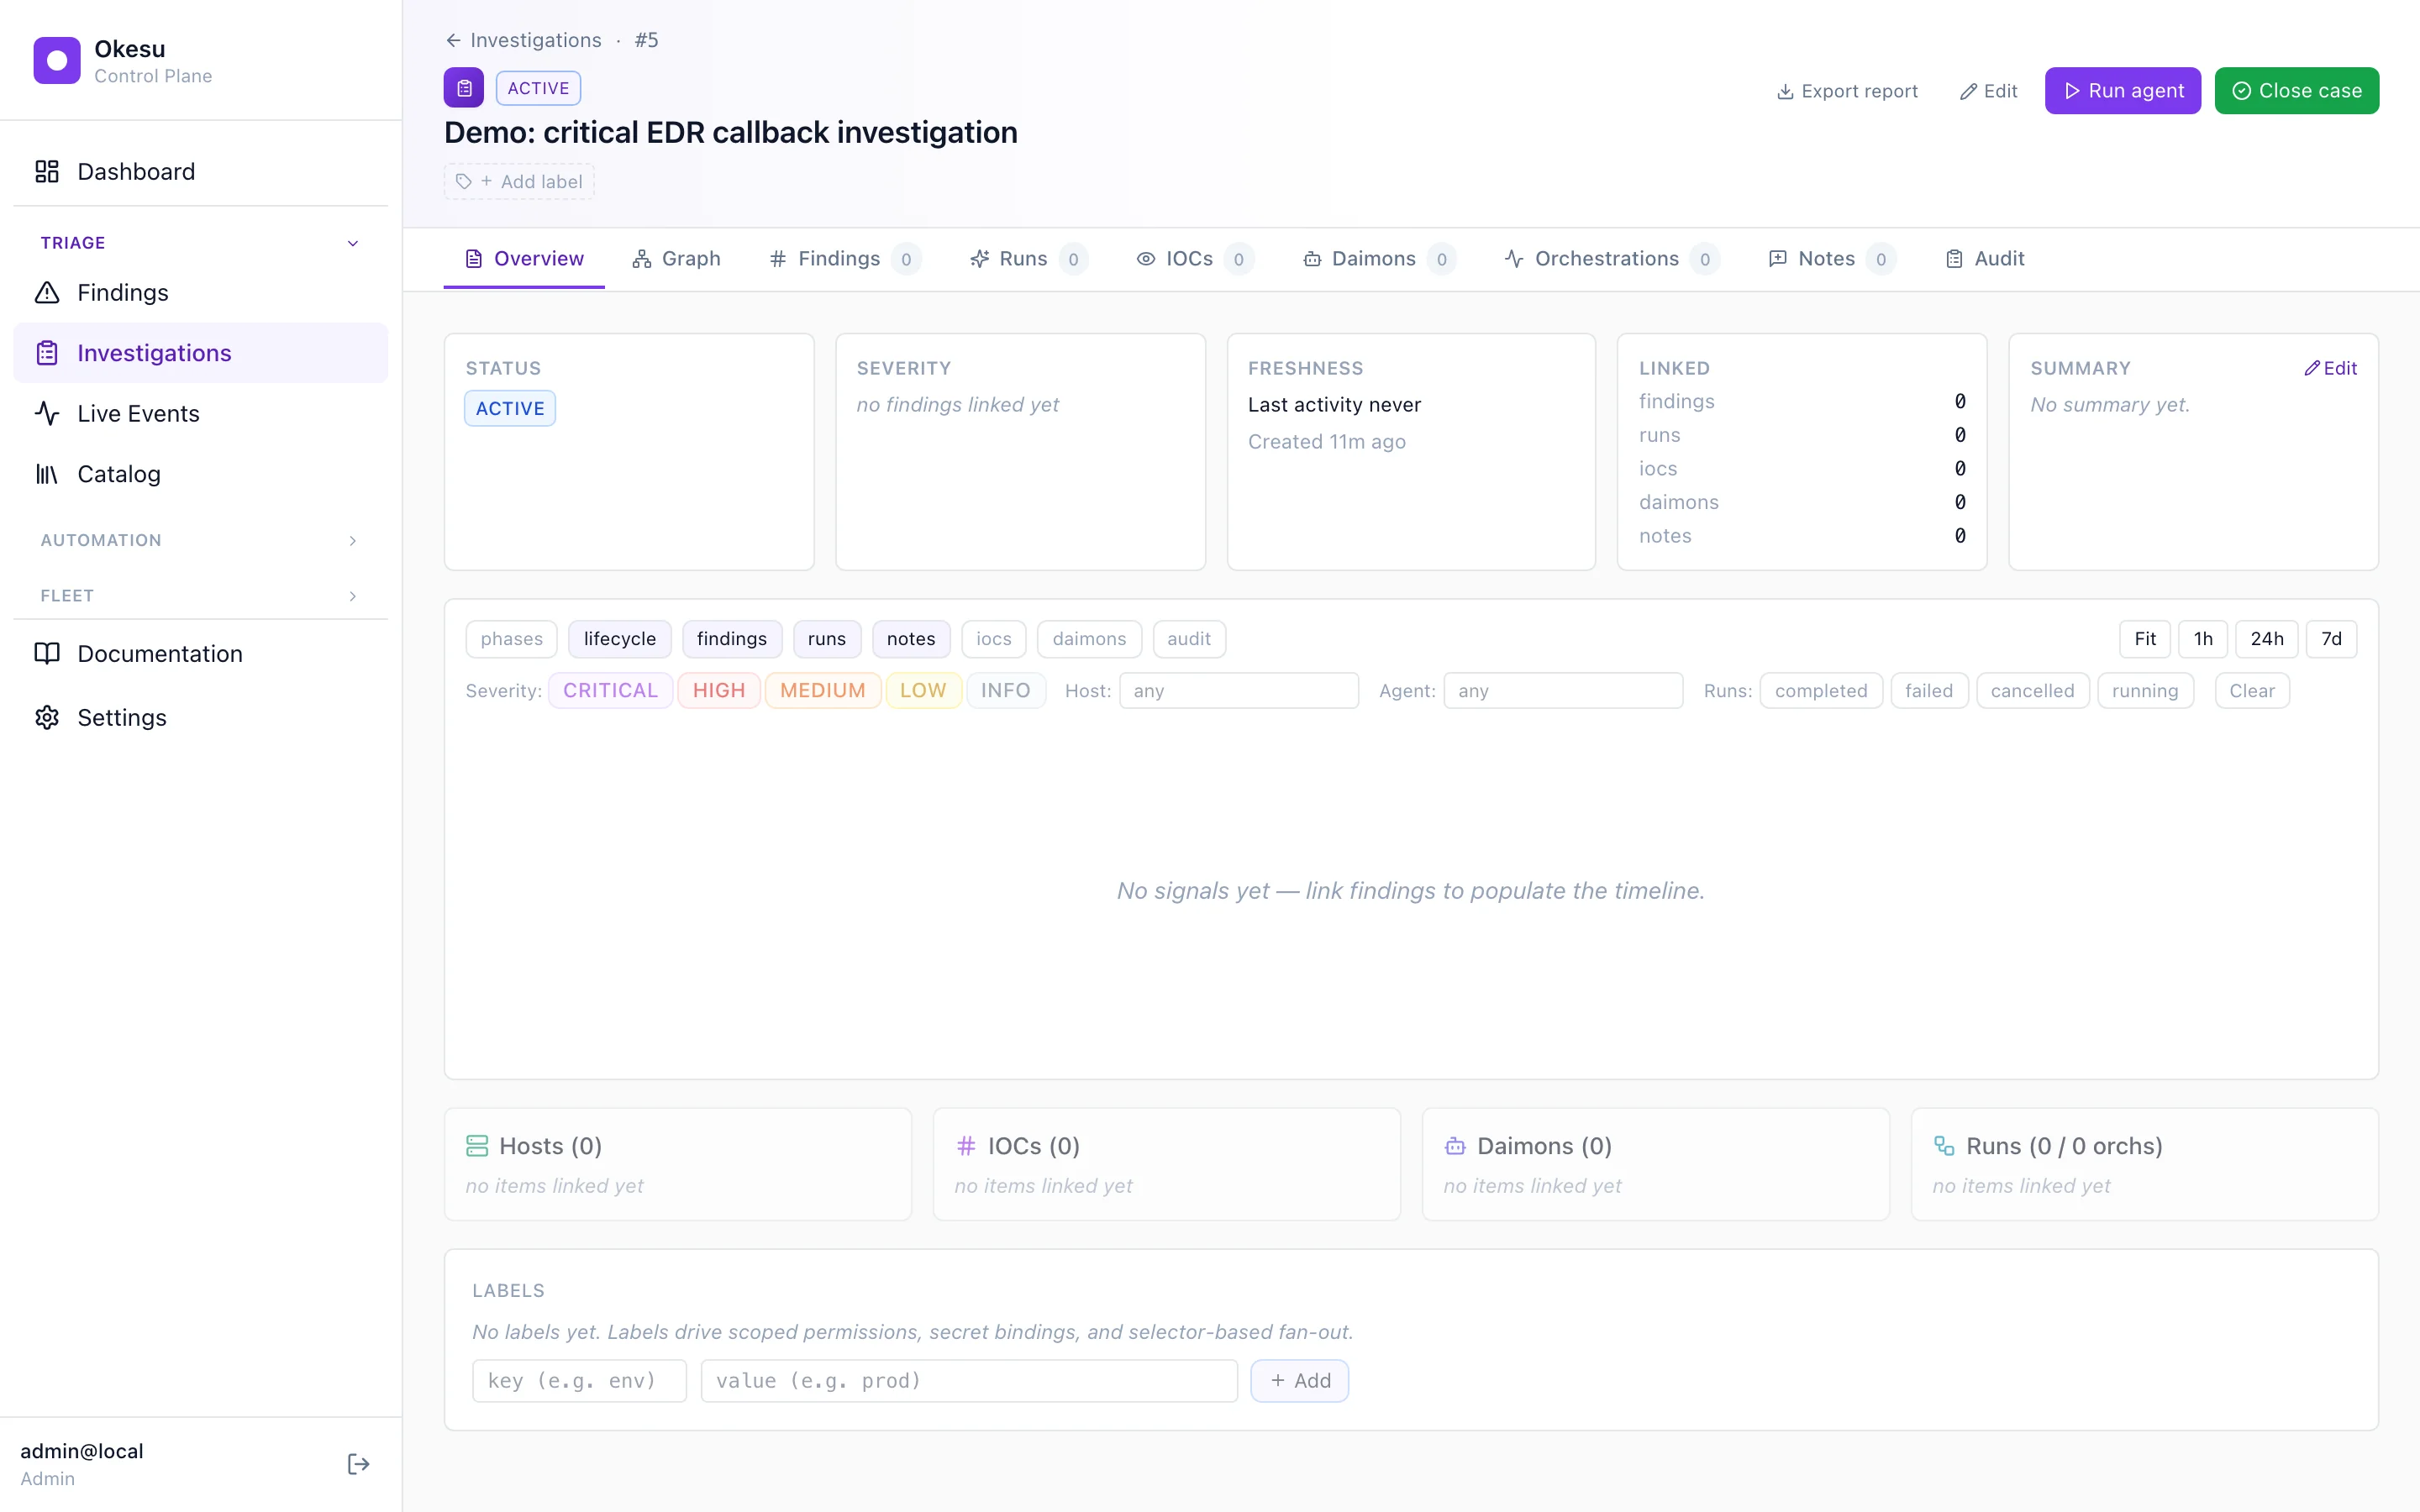
Timeline filtered to severity ≥ HIGH and run-status = approved.
The graph
The Graph tab shows the case's relationships as a bipartite layout — hosts on one side, IOCs on the other, edges for each observed relationship. Server-side aggregation rolls up host/IOC/daimon/run counts so the frontend doesn't walk the entity graph itself; the response shape is the same whether the case is owned by this CP or proxied from a child.
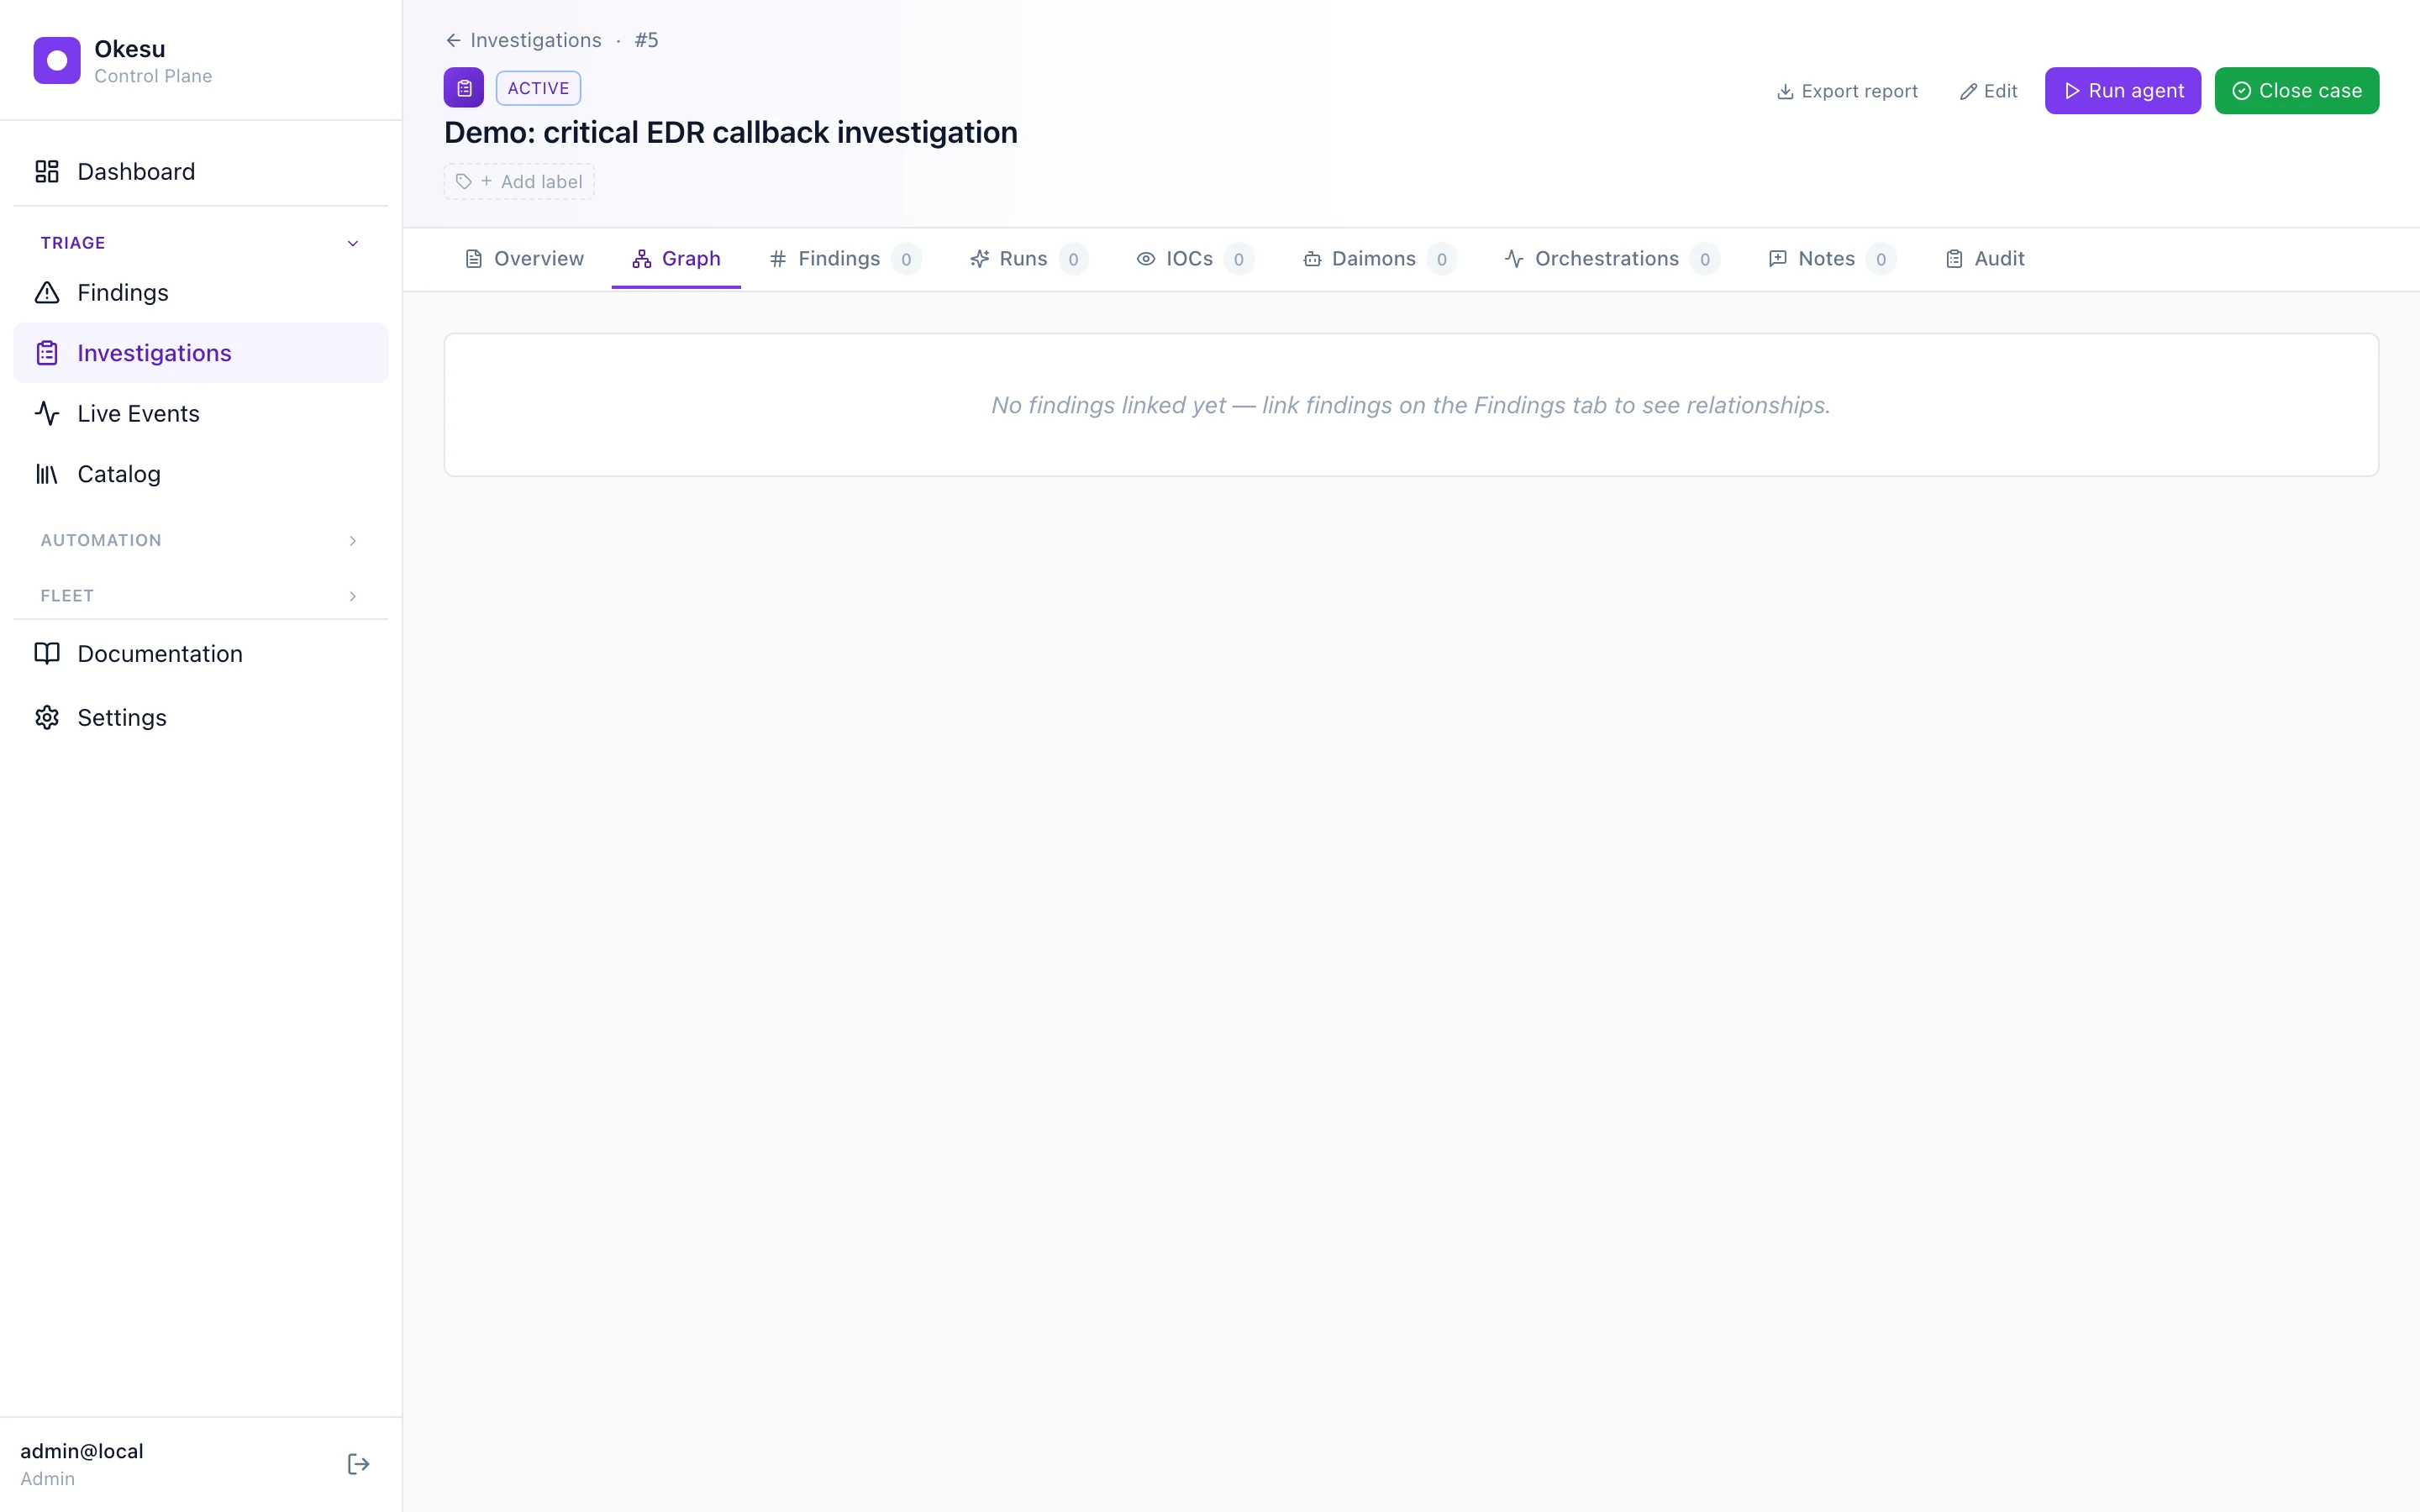
Graph view — relationships as edges between hosts and IOCs.
The war room
The Notes tab has two modes: a quick comment composer for one-off observations, and a war room draft buffer for live collaborative thinking. Open the war room from the case detail page and everyone connected sees each other's cursors, types into the same textarea, reads each other's contributions in real time. Yjs CRDT under the hood — operations are eventually consistent, brief network blips don't lose anyone's input. When the team's done, one operator hits Send and the draft becomes one immutable note row.
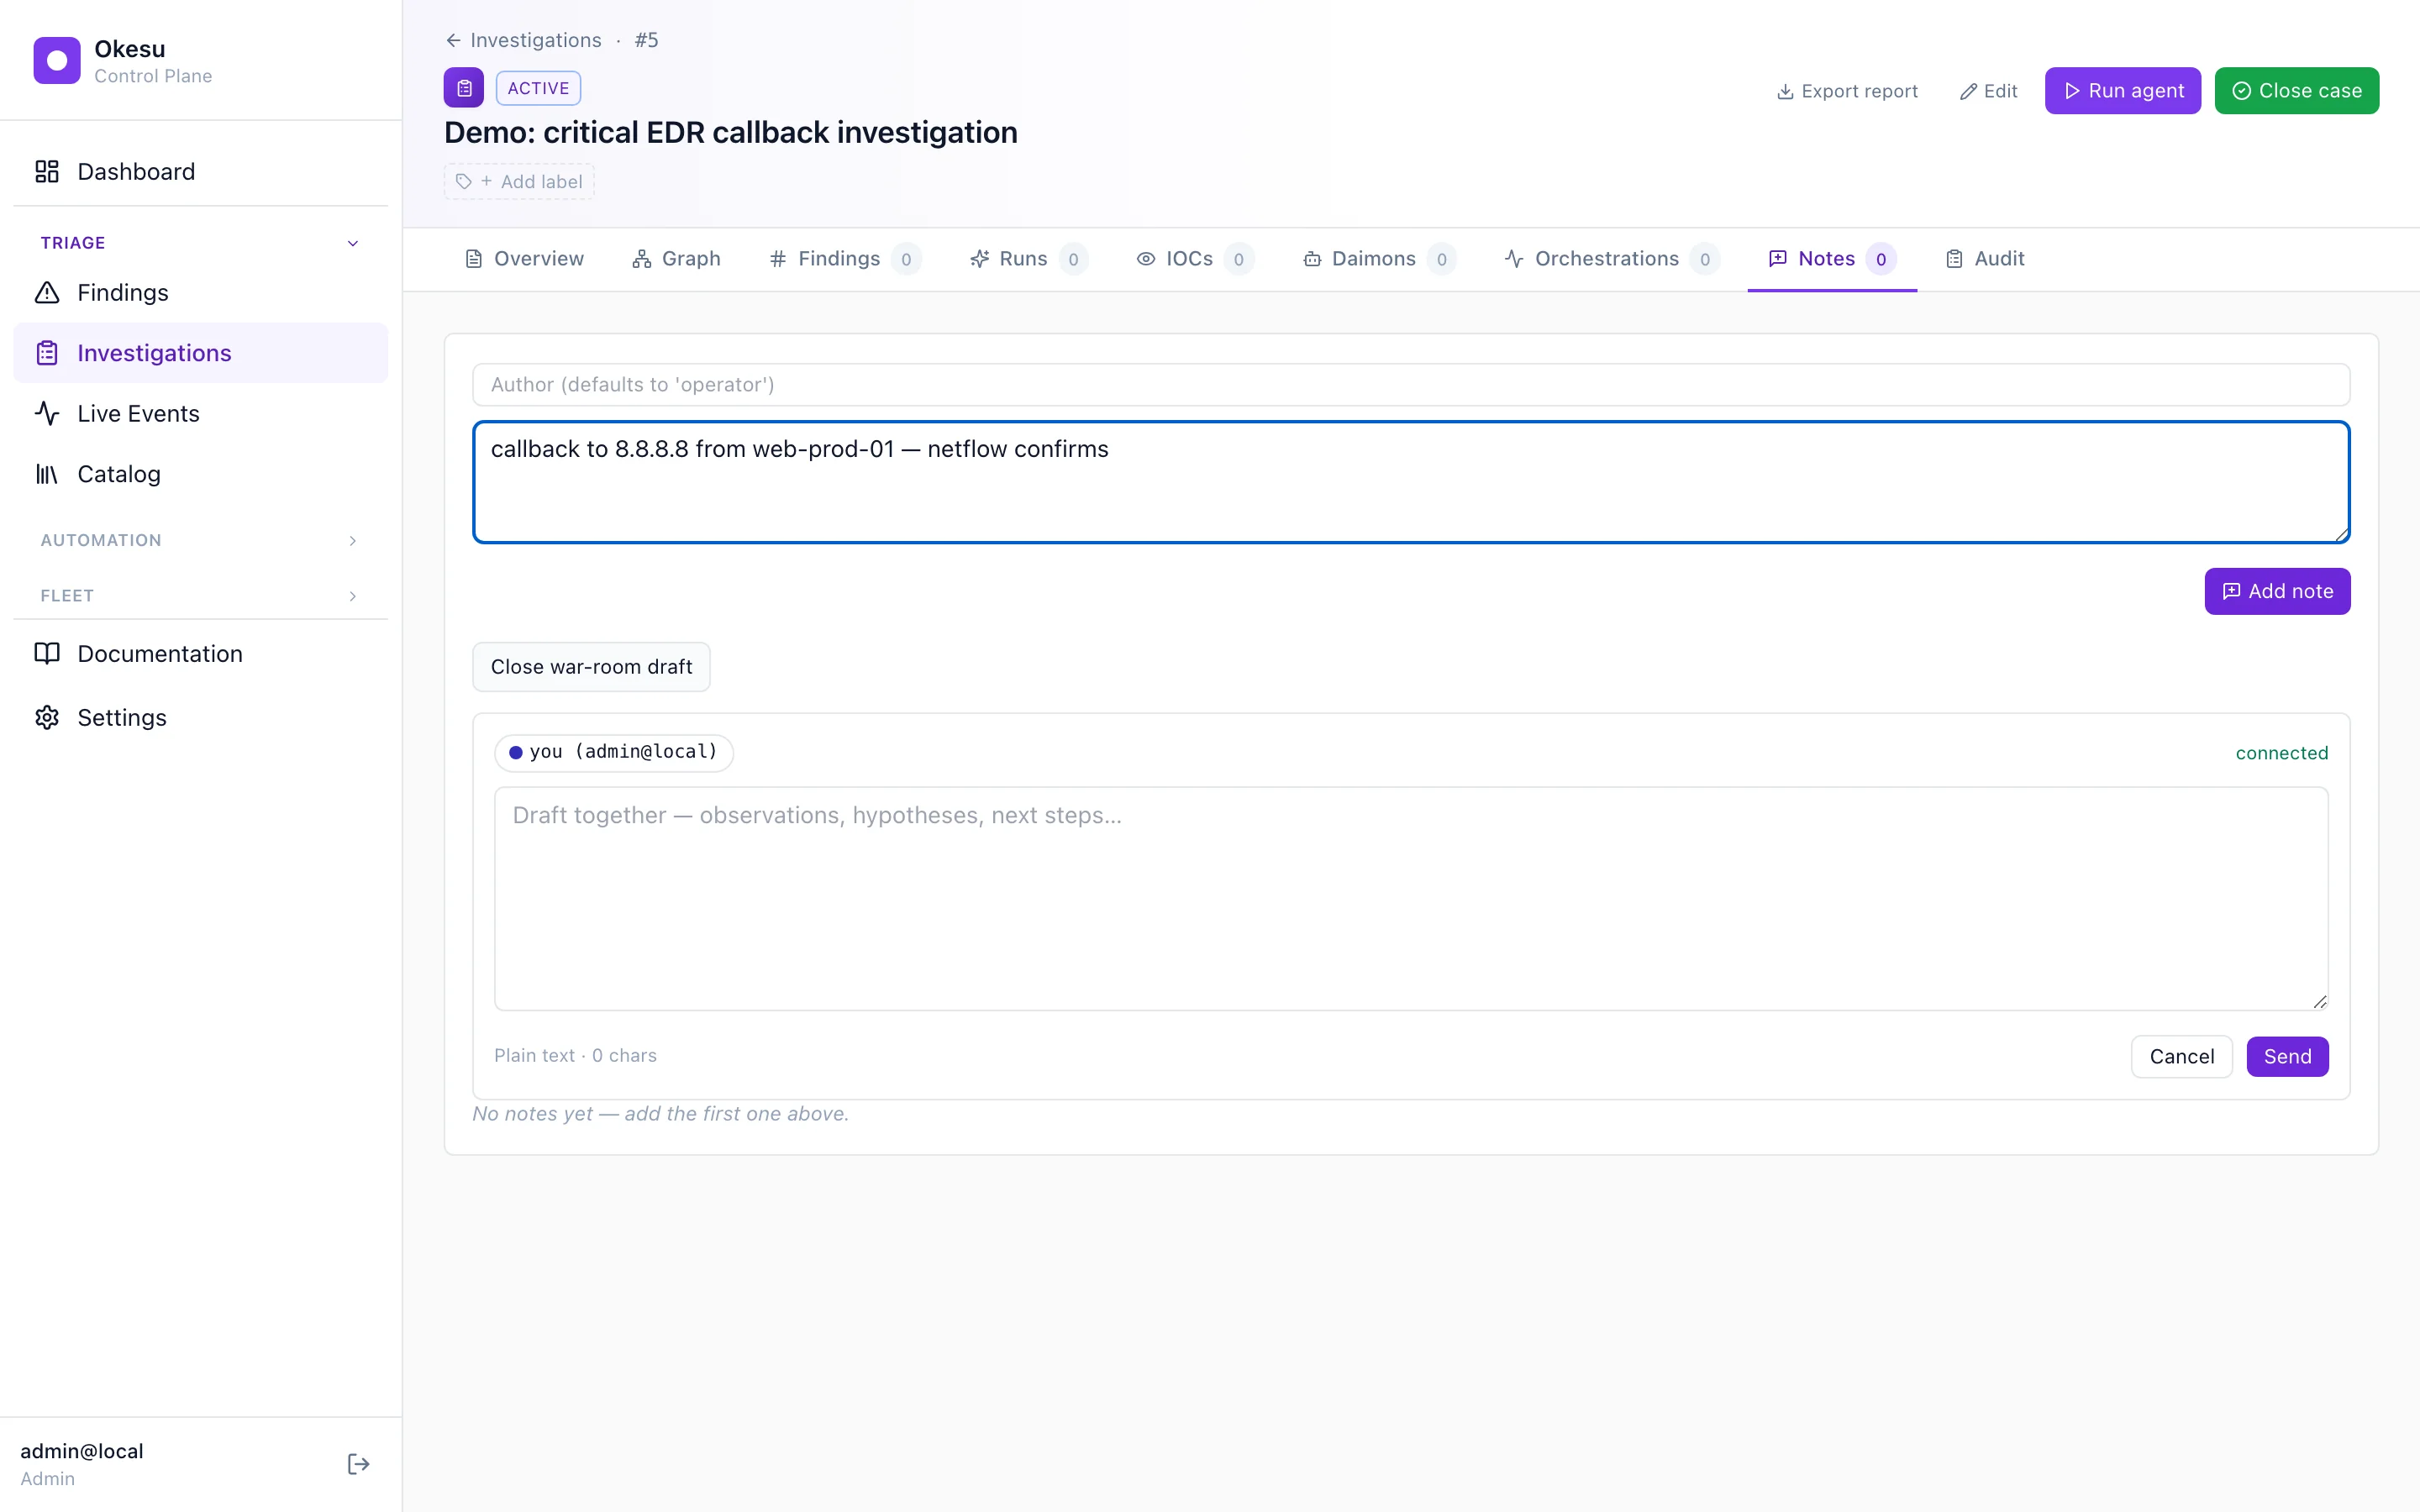
Two operators editing the same buffer. Send produces one immutable note row.
The handoff
Stakeholders rarely log into Okesu. The PDF export gives them everything they need without one: an executive summary on page one, a chronological narrative through the investigation, every linked finding/IOC/run/audit event in formatted reference tables. The endpoint is federated — a parent CP can serve a report for a child's case by proxying the request through the federation token.

Page one of the rendered PDF. One click, stakeholder-ready.
That was the loop.
Daimon emits a finding. CP routes it. Orchestration triages it. Investigation files it. Operators thinking together close it; the PDF goes to whoever needs it. Daimons keep ticking; the same loop runs the next time something interesting happens.
What you saw is what ships. There's nothing demo-only above — the daimons, the orchestrations, the investigation page are all in the platform's defaults; the screenshots came from a CP started fifteen minutes before this page was written.